
OBSERVATION MAP
Create an Observation Map to visualise all your recorded data with just a few clicks.
-
![]()
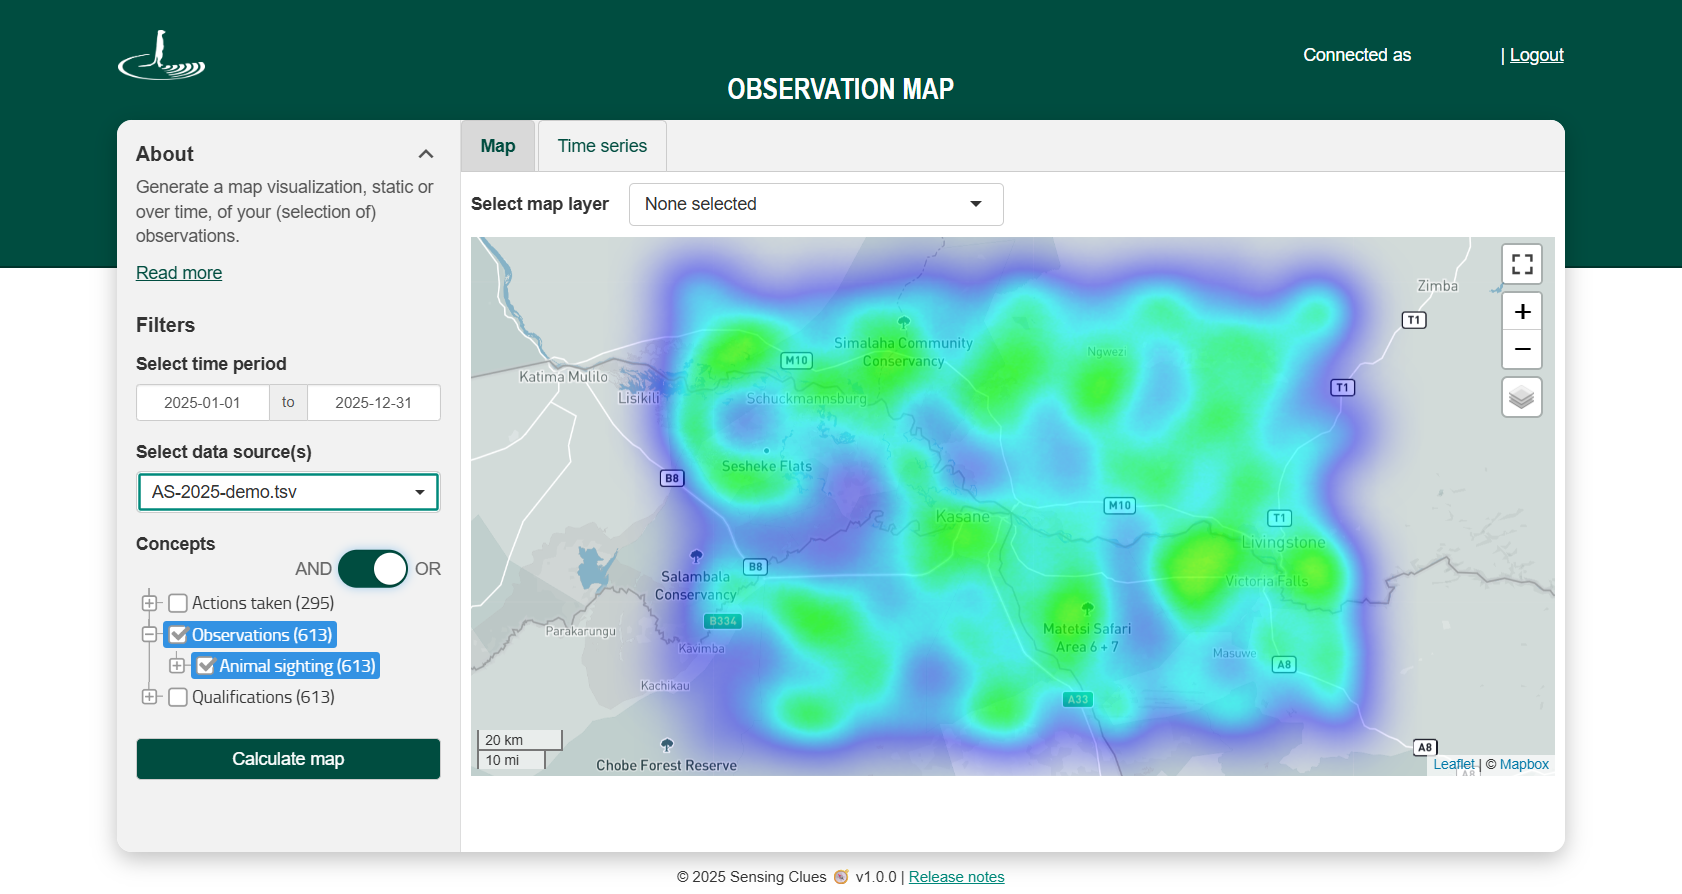
Heat Map
-
![]()
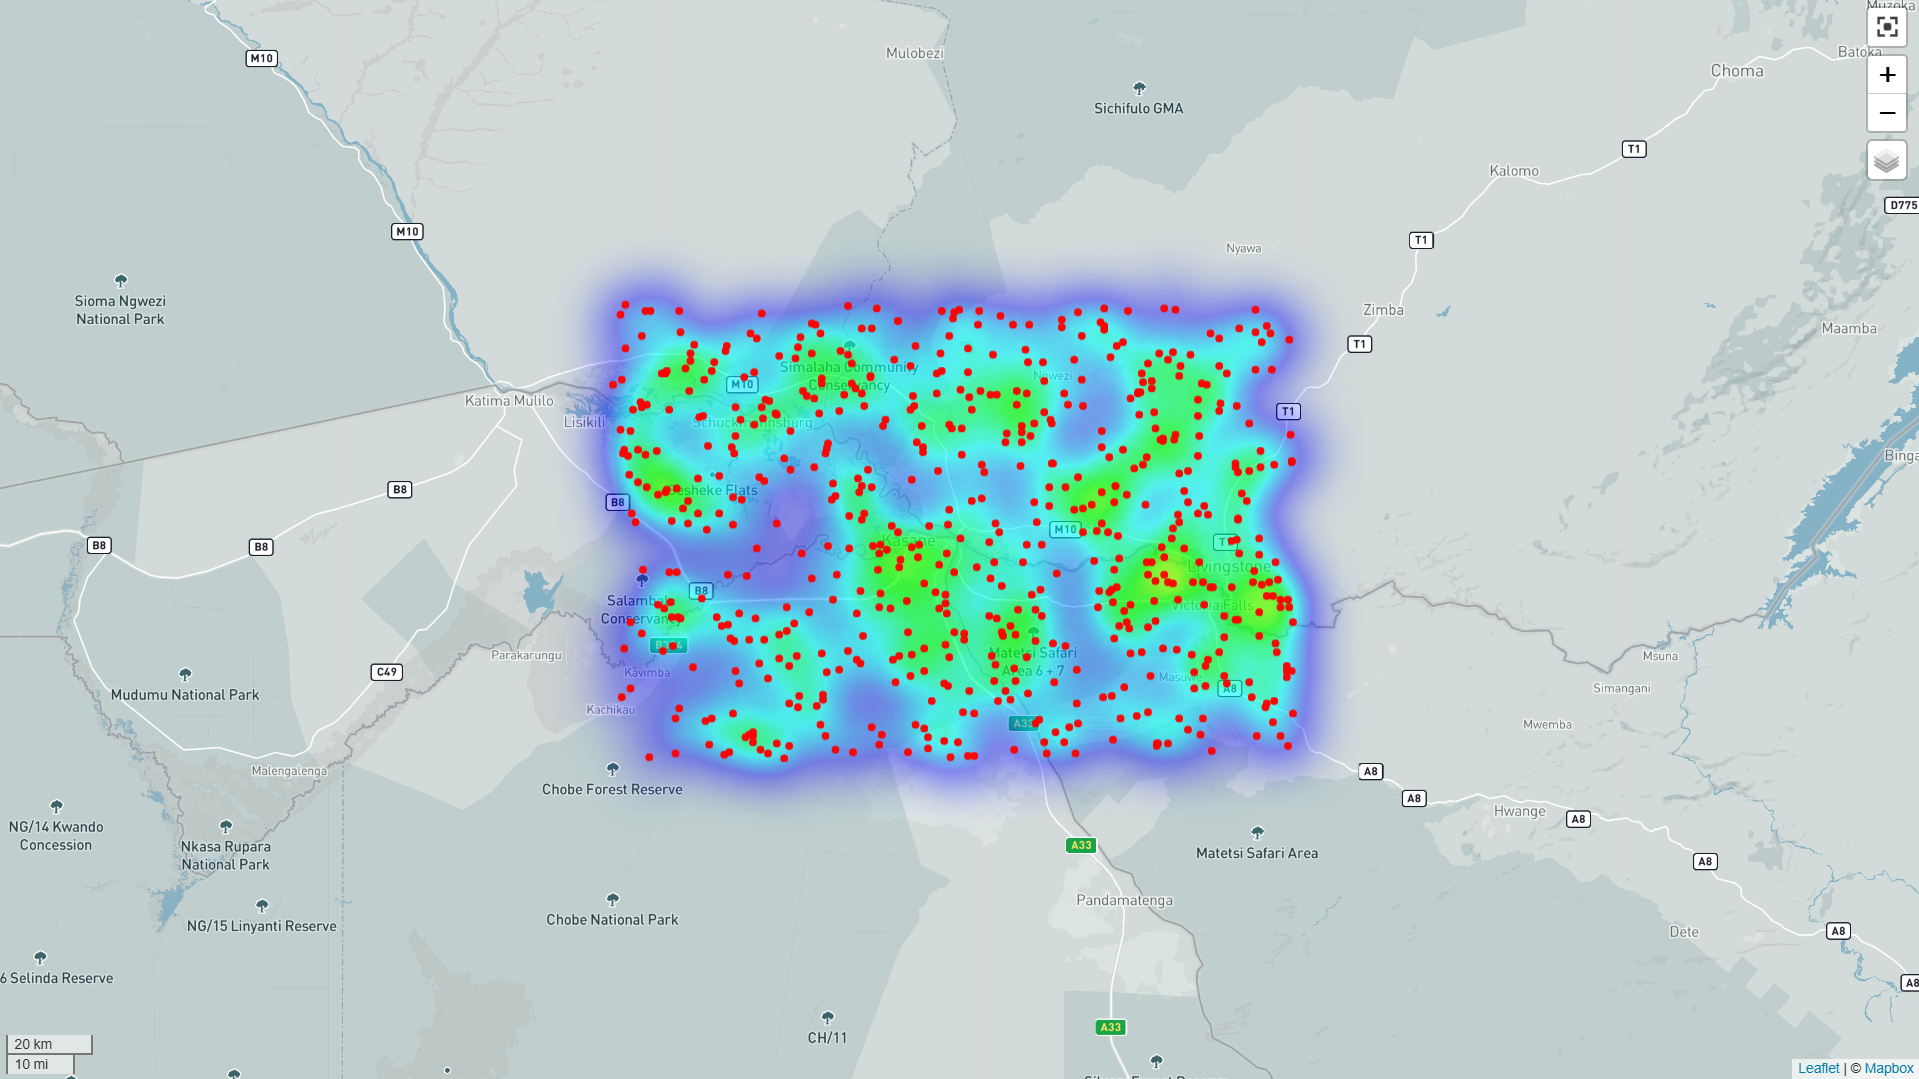
Observations Toggled On
-
![]()
Full Screen View
-
![]()
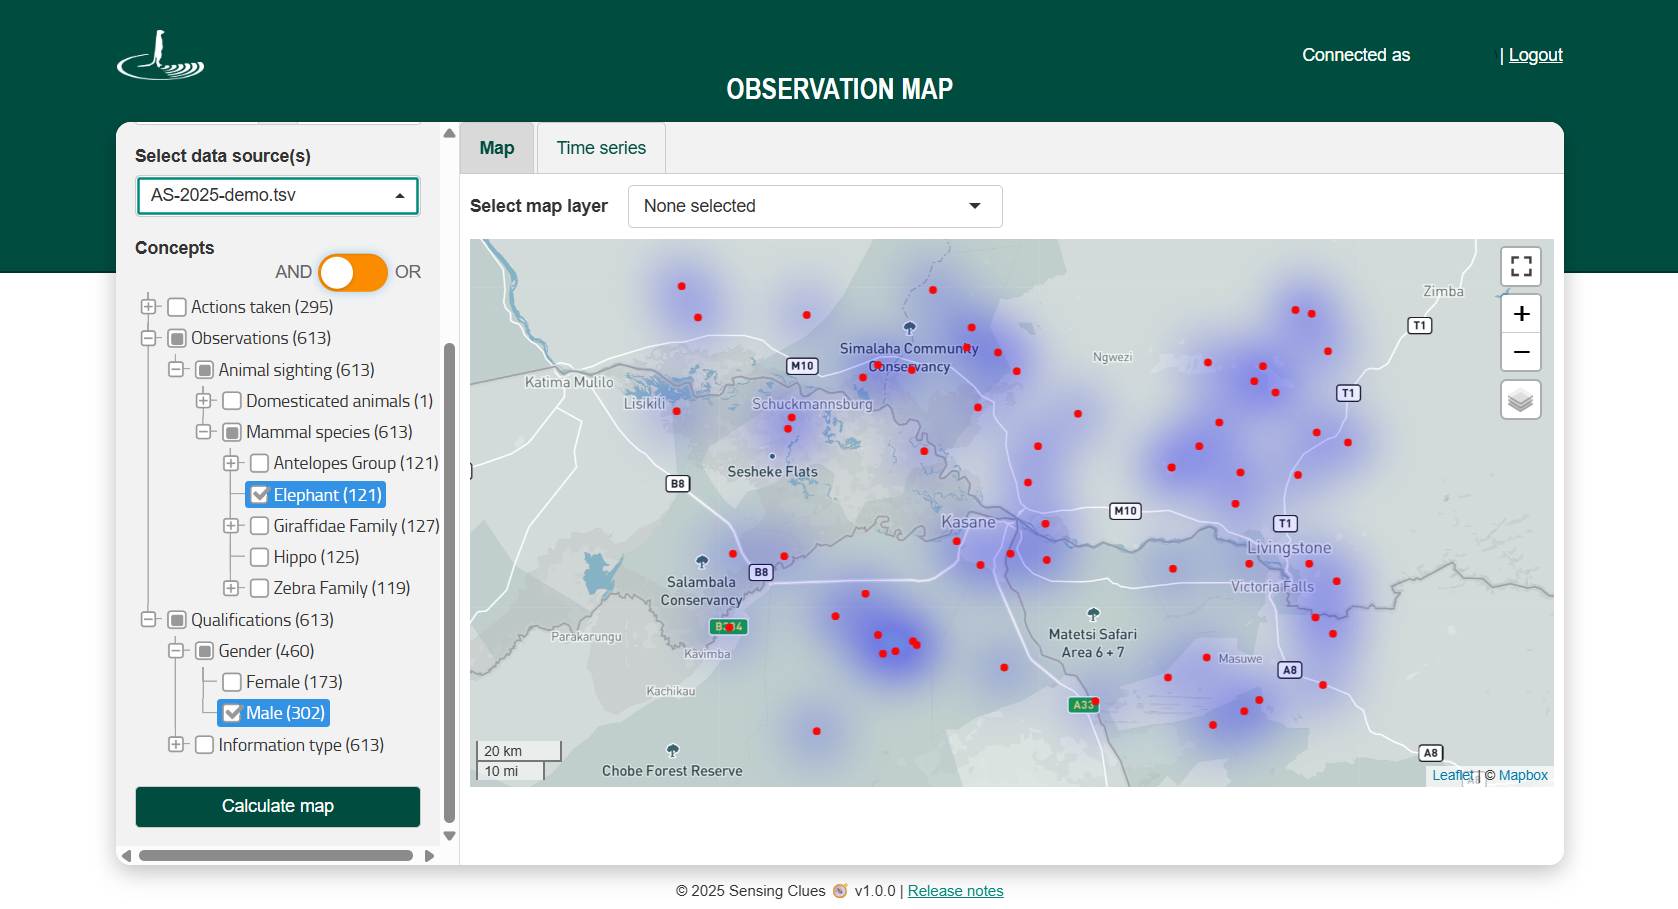
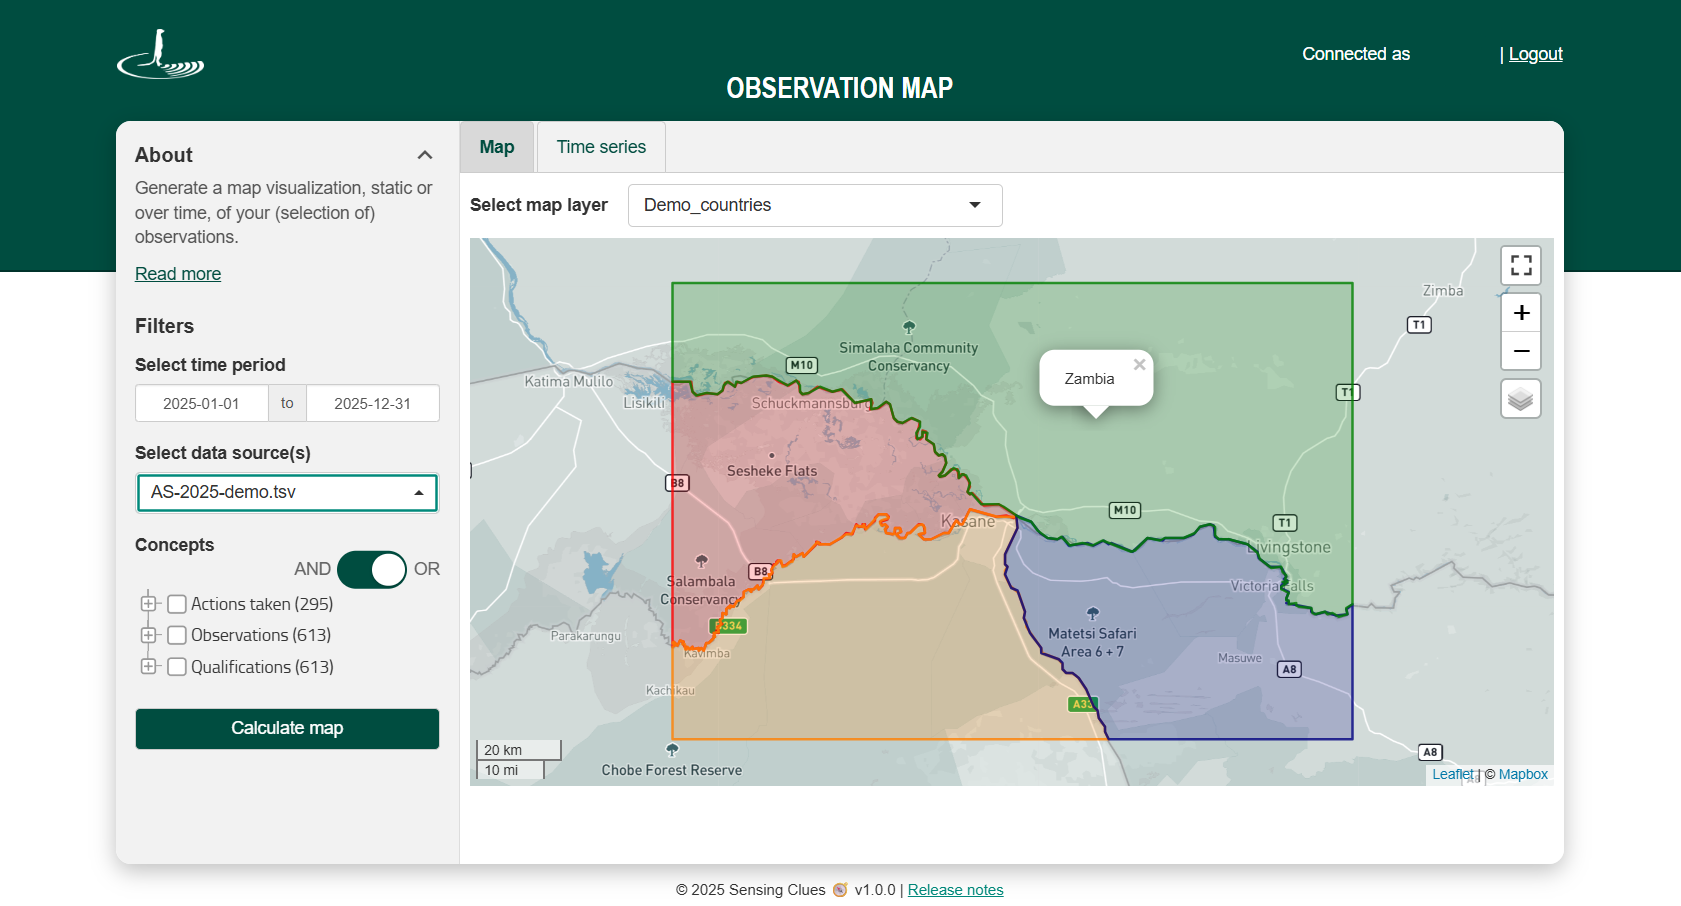
AND/OR Filtering
-
![]()
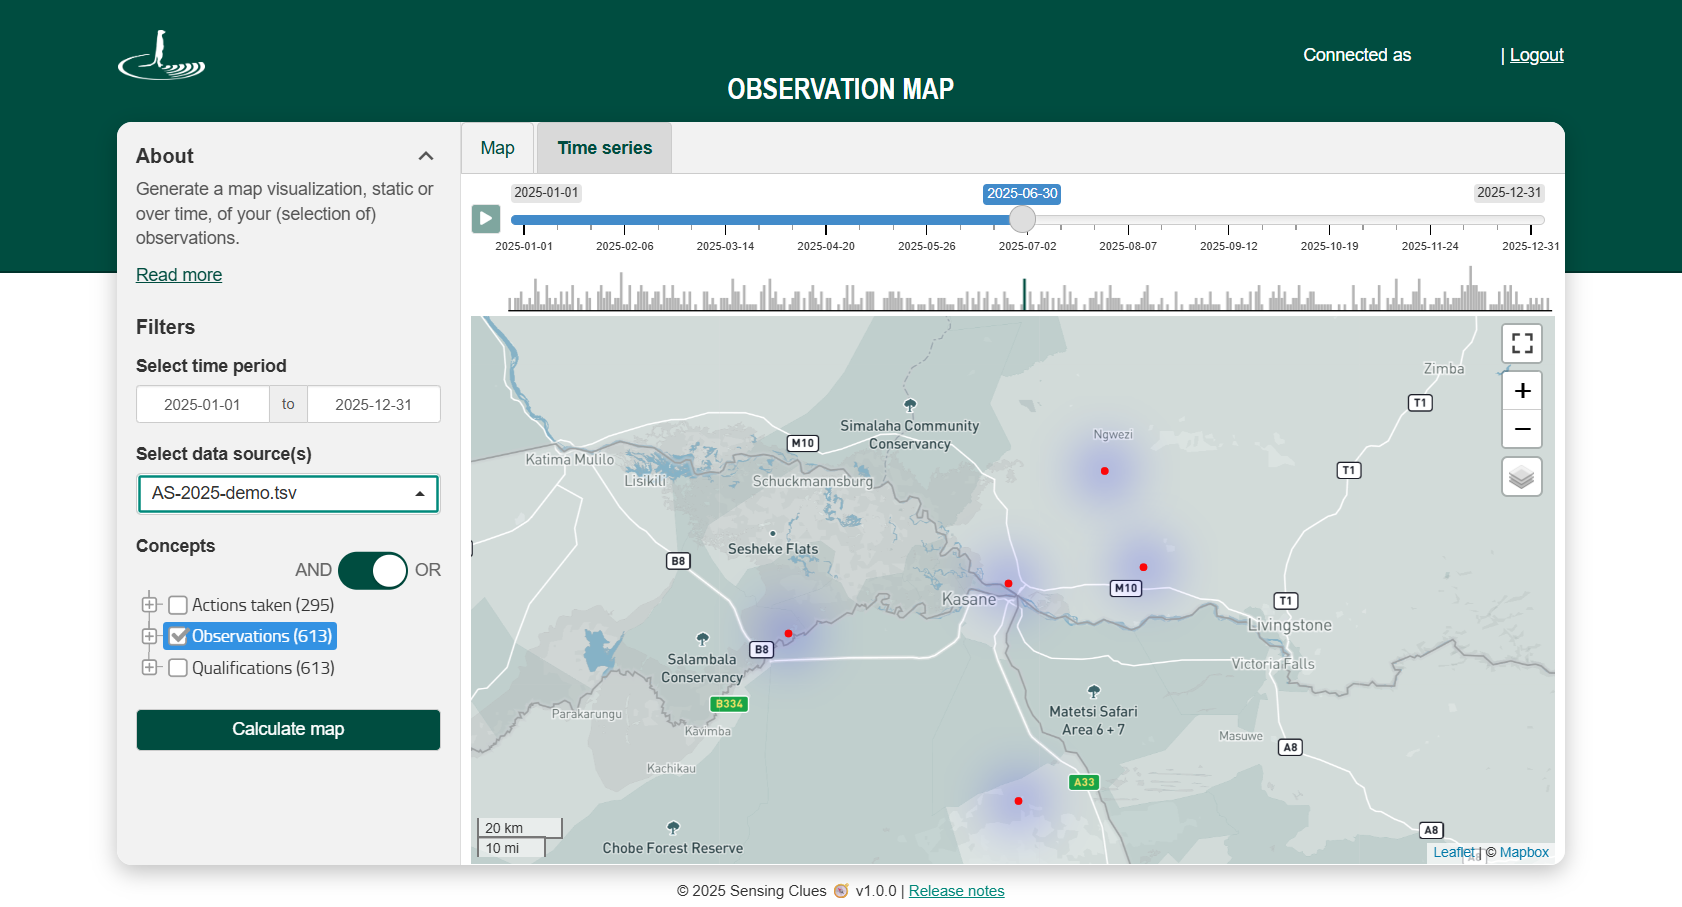
Time Series Playback
-
![]()
Own Map Layer
-
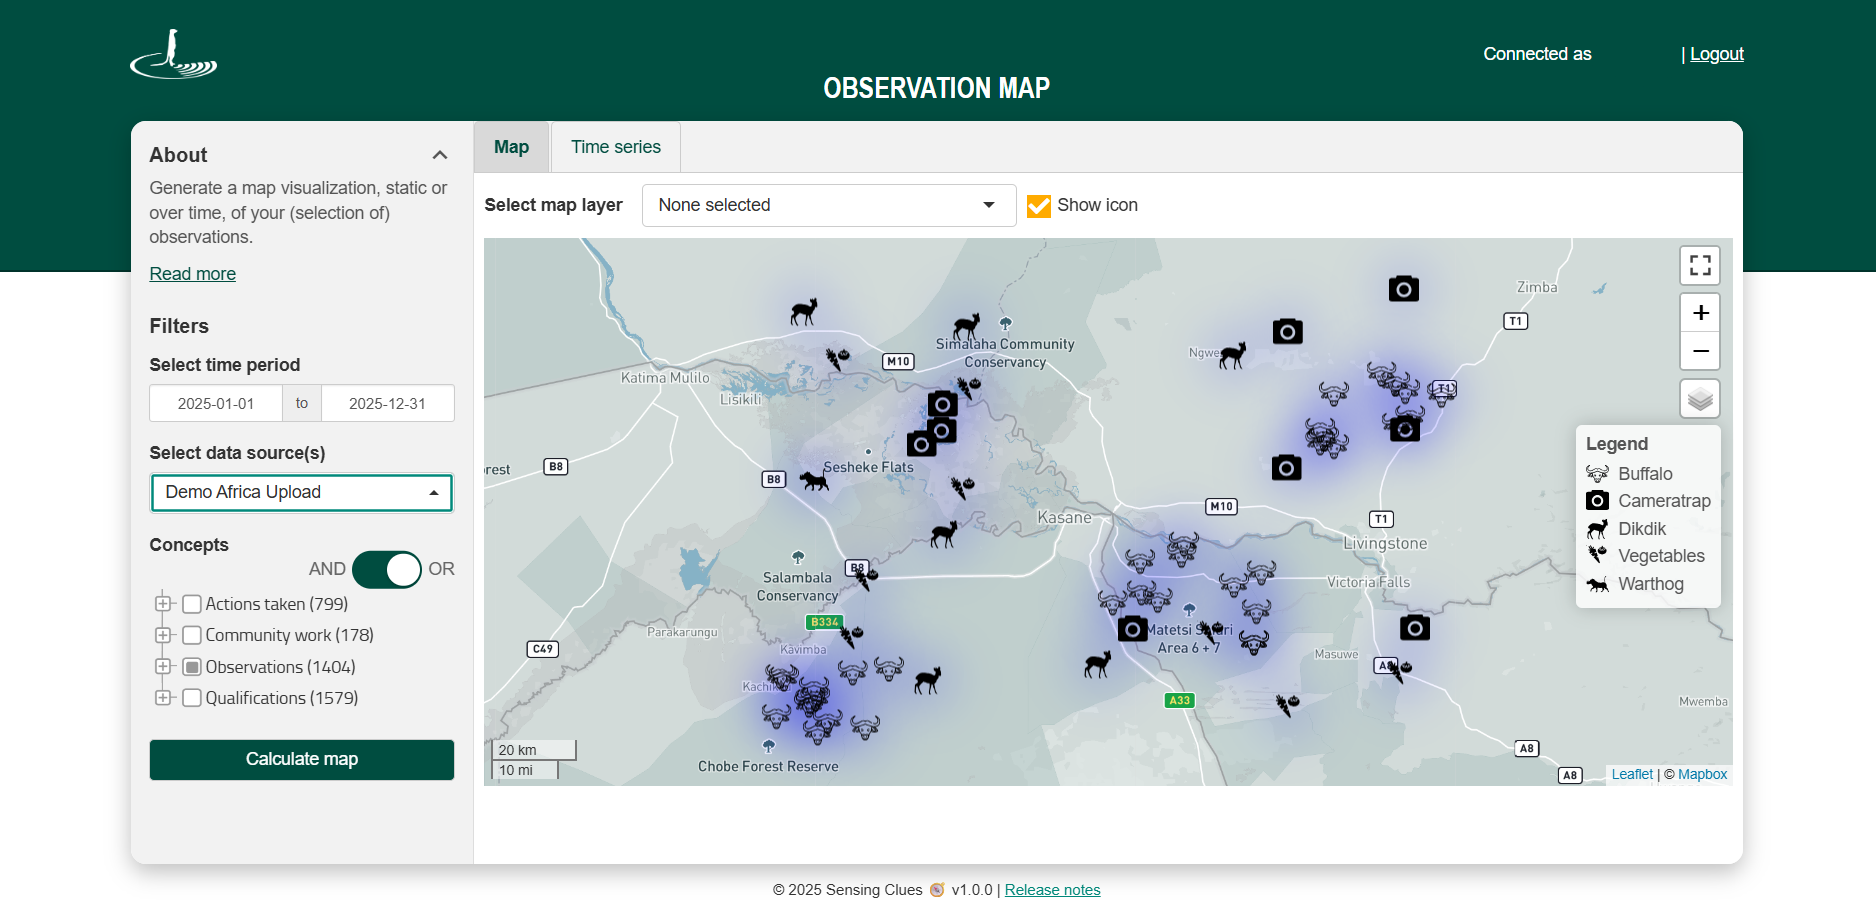
![Show Icons]()
Show Icons

Key Features
Create a map for a specific concept or any combination of concepts.
Highlight hotspots (Note: Also known as a heat map).
Generate maps by data source (e.g. Cluey groups or uploaded data) or across multiple data sources.
Overlay your map with your own map layers (Note: Available to Premium subscribers with Upload Service access or appropriate permissions in Central).
Select any desired time period.
Toggle “Show icon” on or off to display up to 9 icons, with a multilingual icon legend available.
Visualisation Options
View all data at once on the map, or play it back in recorded time sequence.
View the heat map with or without individual observations.
How it works
Log in with your Cluey credentials.
Select your time period.
Choose the data source(s) you wish to include.
Choose the concepts you wish to include.
Click “Calculate map” to generate your map.