
MEASURING IMPACT & PREDICTING POTENTIAL CONSERVATION PROBLEMS HAS NEVER BEEN EASIER
With our intelligent conservation technology, lengthy data analysis or running behind the facts belong to the past.
Unlock in-depth maps & reports with data-driven analytics powered by cutting-edge conservation technology.
Our cutting-edge maps and reports support wildlife protection and nature conservation — from high-quality Observation, Likelihood and Patrol Maps to detailed Observation, Patrol and Activity Pattern Reports, plus Community Work Reports that let you monitor and evaluate community-led conservation activities with just a few clicks.
Now available: Sensing Clues Impact Reporting, offering solutions for every stage of your reporting journey — from real-time dashboards to customised stakeholder-ready reports.


Foster transparency & accountability
Share the status of your work without spending hours on data analysis.
Get direct insights & predictions of events
Via our visual maps, complex data is made understandable.
Showcase the impact of your activities
Highlight the impact of your activities with reports that are easy to generate.
HOW OUR PARTNERS USE OUR ANALYTICS

“Sensing Clues' real-time insights and reports are vital in our fight against rhino poaching, providing us with instant access to the information we need.”
Black Mambas all women APU, South Africa
WILDLIFE PROTECTION


“The Sensing Clues platform helps us collect patrol data in the field and document activities - essential for both our Biodiversity and Community sections.”
Carbon Tanzania, Tanzania
COMMUNITY-LED CONSERVATION
Ensure transparent reporting for improved accountability.
Enhance transparency with our advanced analytics software - part of our cutting-edge conservation technology. Automate report generation and statistical analysis to save time and deliver clear insights to your stakeholders. Access ready-to-use reports, interactive maps, and comprehensive data exports designed for conservation impact.
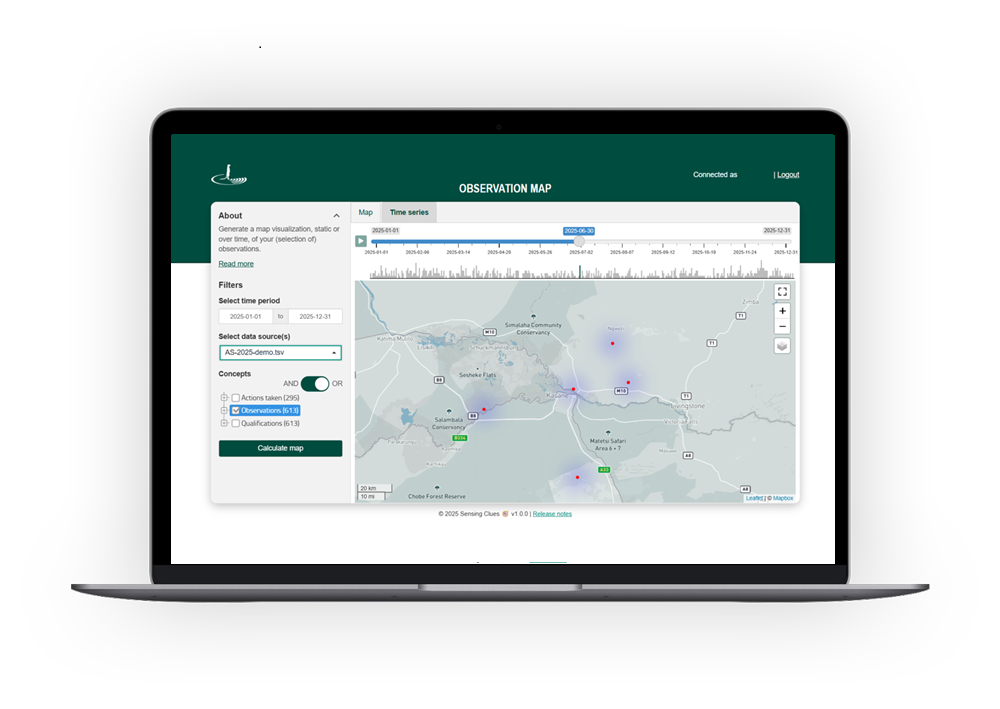
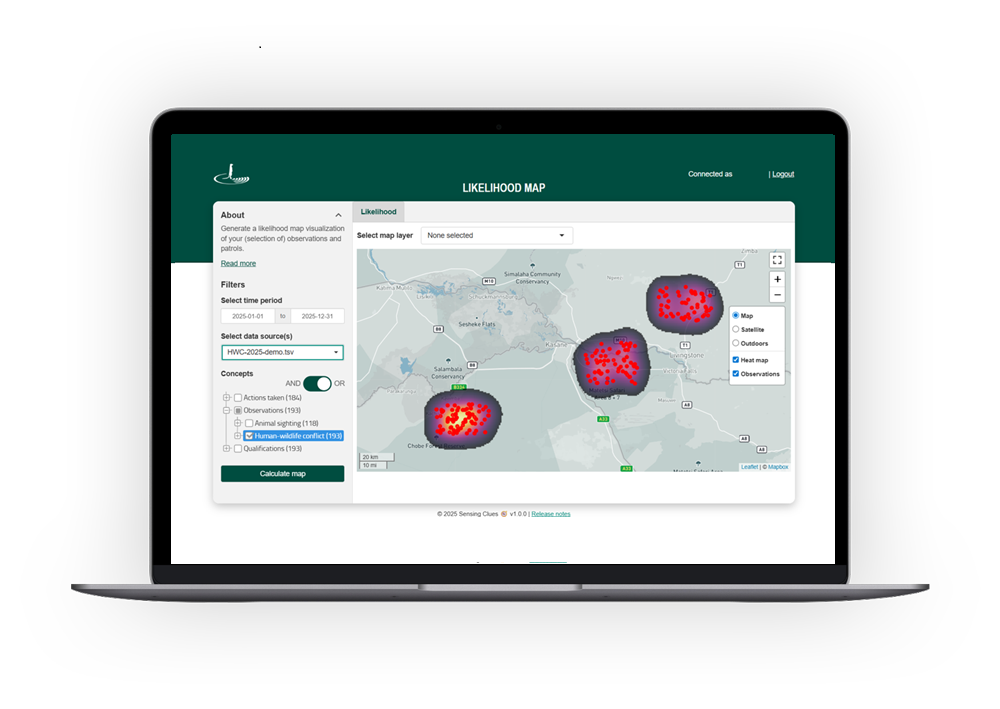
Instant insights into current situations or the likelihood of events through powerful visual & interactive maps.
Experience clear visualisations of wildlife sightings, environmental changes, and patrol routes with our interactive Observation and Patrol Maps. Stay one step ahead with our data-driven Likelihood Maps, visualising event probabilities across various areas.
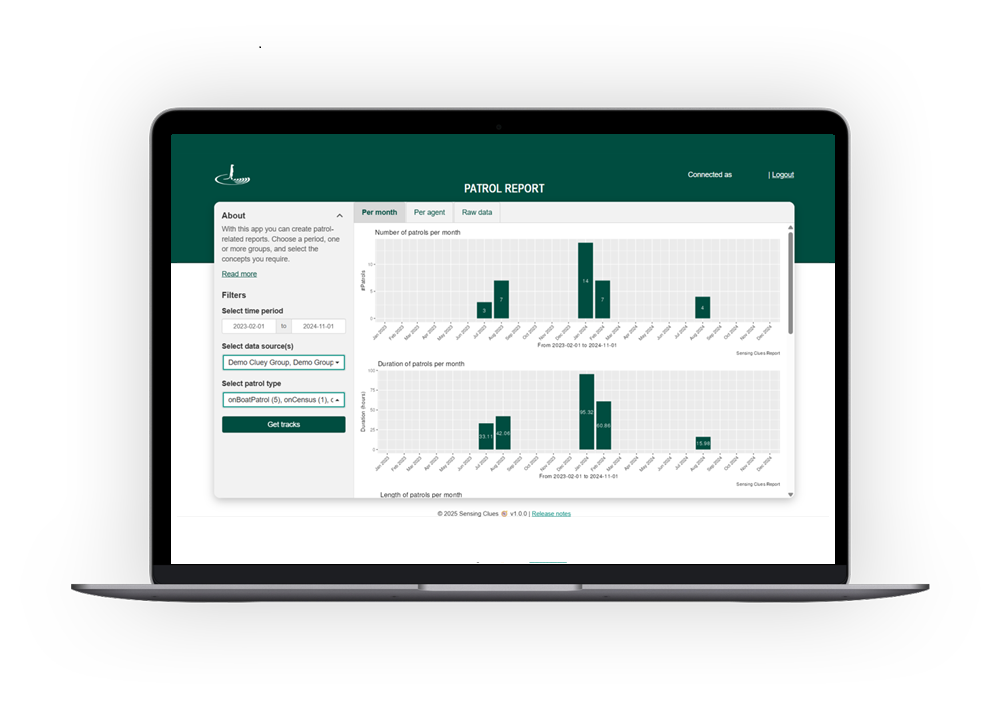
Creating a report has never been easier.
Our advanced conservation technology and analytics software lets you generate reports and statistical analysis automatically. Save time while delivering clear insights to your stakeholders with ready-to-use reports, maps and comprehensive data exports.
Choose from a variety of ready-to-use reports.
Access four automated report generators powered by cutting-edge conservation technology — plus Sensing Clues Impact Reporting, providing real-time dashboards and customised reports for transparent and comparable insights across all your projects.
Provide stakeholders with everything they need in just a few clicks. Highlight your community activities’ impact with our Community Work Reports, gain actionable insights into your field operations with our Observation and Patrol Reports, and uncover when your target species are most active with our Activity Pattern Reports.
Need a customised dashboard or report tailored to your organisation's reporting needs? We've got you covered!
WHAT OUR PARTNERS SAY
-
![]()
“The communication role that the Cluey app plays, has changed the way we operate, resulting in instant responses.”
Keith, Head Pilot Anti-Poaching Air Wing, Wildlife Works, Kenya
-
![]()
“Thanks to Sensing Clues, we have seamless data synchronisation and easy access to real-time insights from our field partners, enabling more informed decision-making.“
Roman, Project Officer Wildlife, WWF, Ukraine
-
![]()
“Thank you for going the extra mile: Your personal support is outstanding, and being available 24/7 makes all the difference!”
Craig, Managing Director, Black Mambas all women Anti-Poaching Unit, South Africa
-
![]()
“Sensing Clues has provided invaluable technical support, enhancing our efforts to protect elephants and engage local communities.”
John, Data & Research Coordinator, Wild Survivors, Tanzania
-
![]()
“The Sensing Clues platform is an exceptionally powerful and invaluable tool for harmonising data, monitoring biodiversity, and managing protected areas.“
Boris, Head of Technology Area, 3edata, Spain
-
![]()
“Cluey is the best app I’ve ever used for data collection.“
Nikola, Researcher and Fauna expert, Bulgarian Academy of Science and Vitosha Nature Park Directorate, Bulgaria
-
![]()
“Cluey is extremely user-friendly and requires no technical expertise.“
Cristian, Wildlife and Landscapes National Manager, WWF, Romania
-
![]()
“In one or two clicks I get a summary of all I want to know about any incident. Awesome!”
Moses, Lead Analyst, Wildlife Works, Kenya
-
![]()
“Sensing Clues offers us a powerful platform for data management and analysis.”
Tom, Director, Nsanga Conservation, Zambia
AUTOMATICALLY GENERATE MAPS & REPORTS IN NO TIME
Deliver what you and your stakeholders need with just a few clicks. Try our conservation technology for free.
