
OBSERVATION REPORT
Generate an Observation Report to review and analyse all your recorded observations across selected time periods.
-
![]()
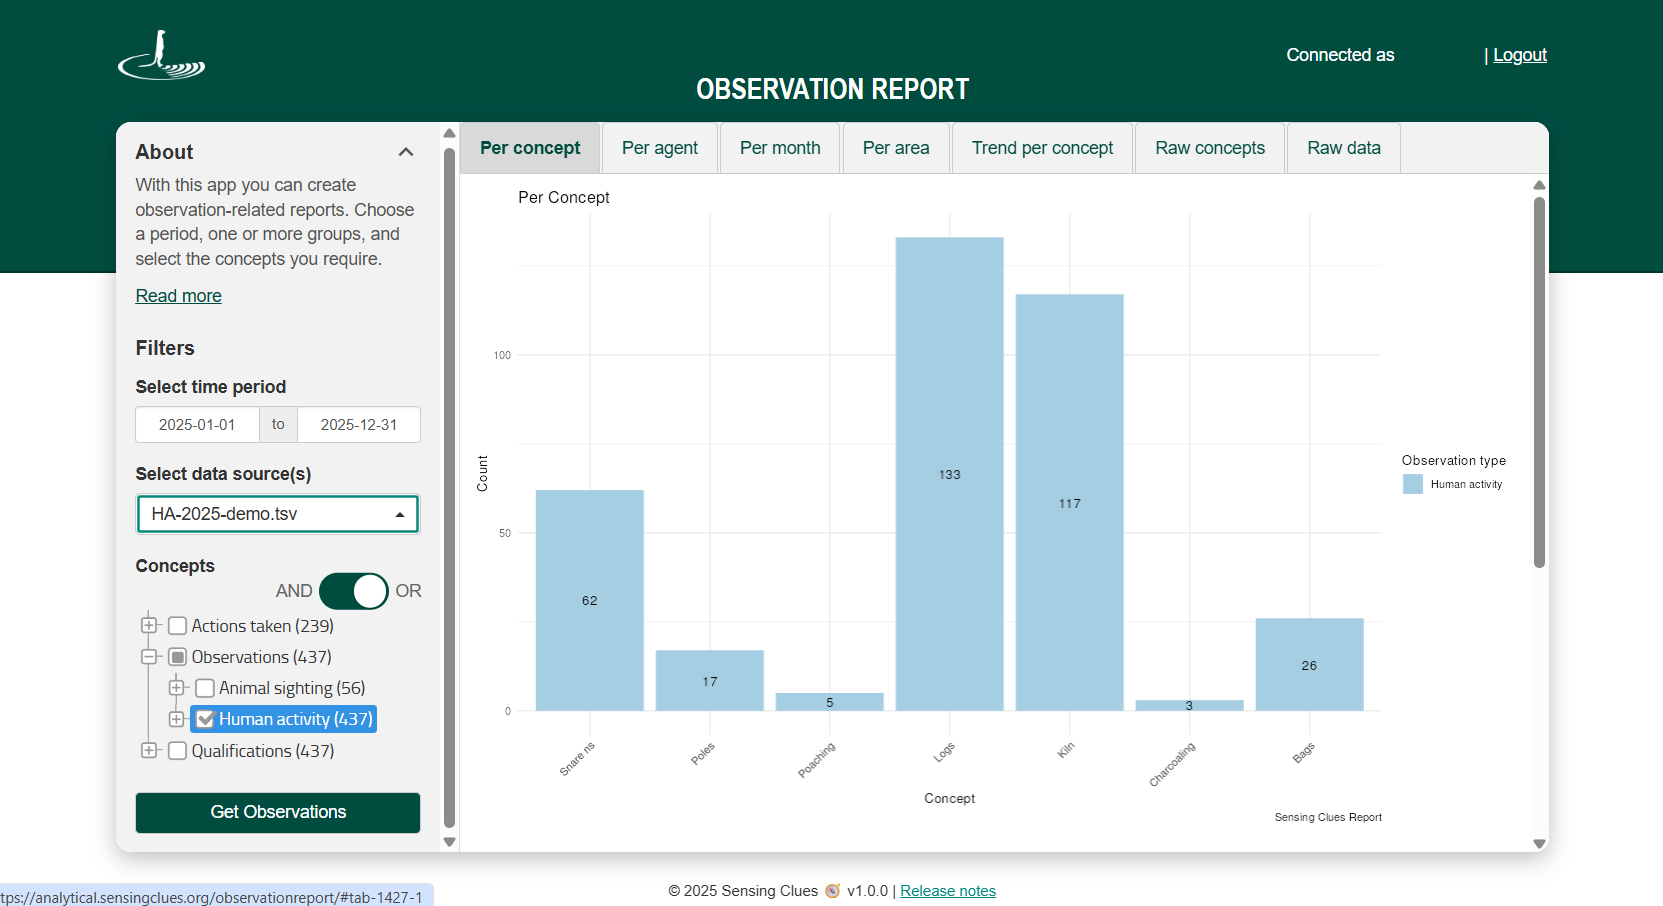
Reporting per Concept
-
![]()
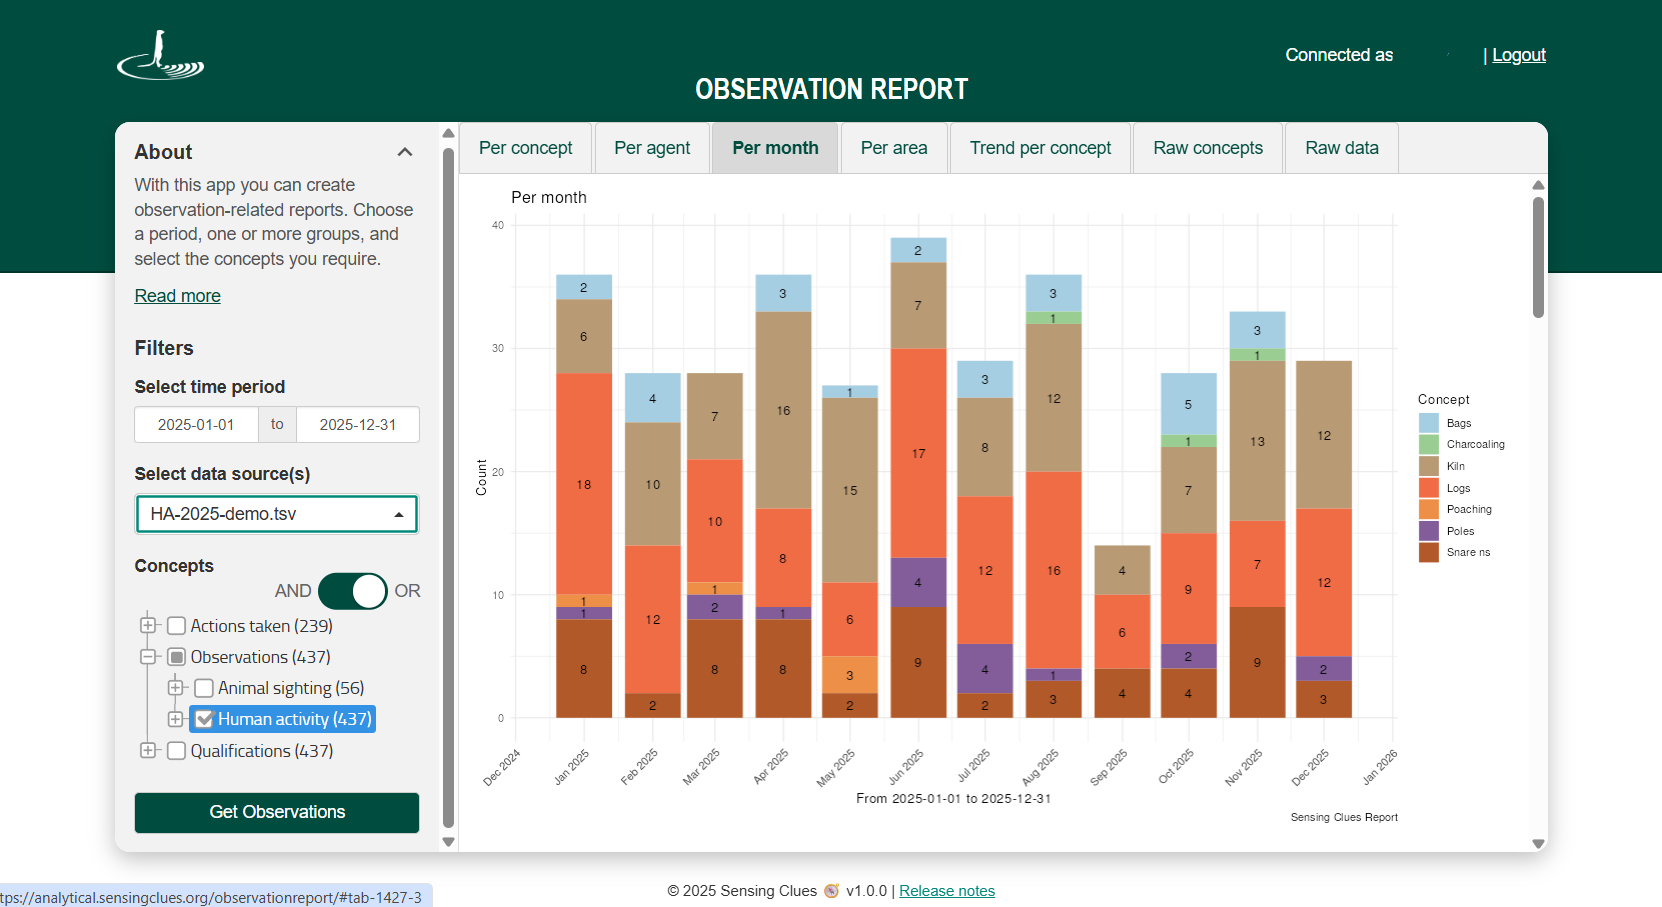
Reporting per Month
-
![]()
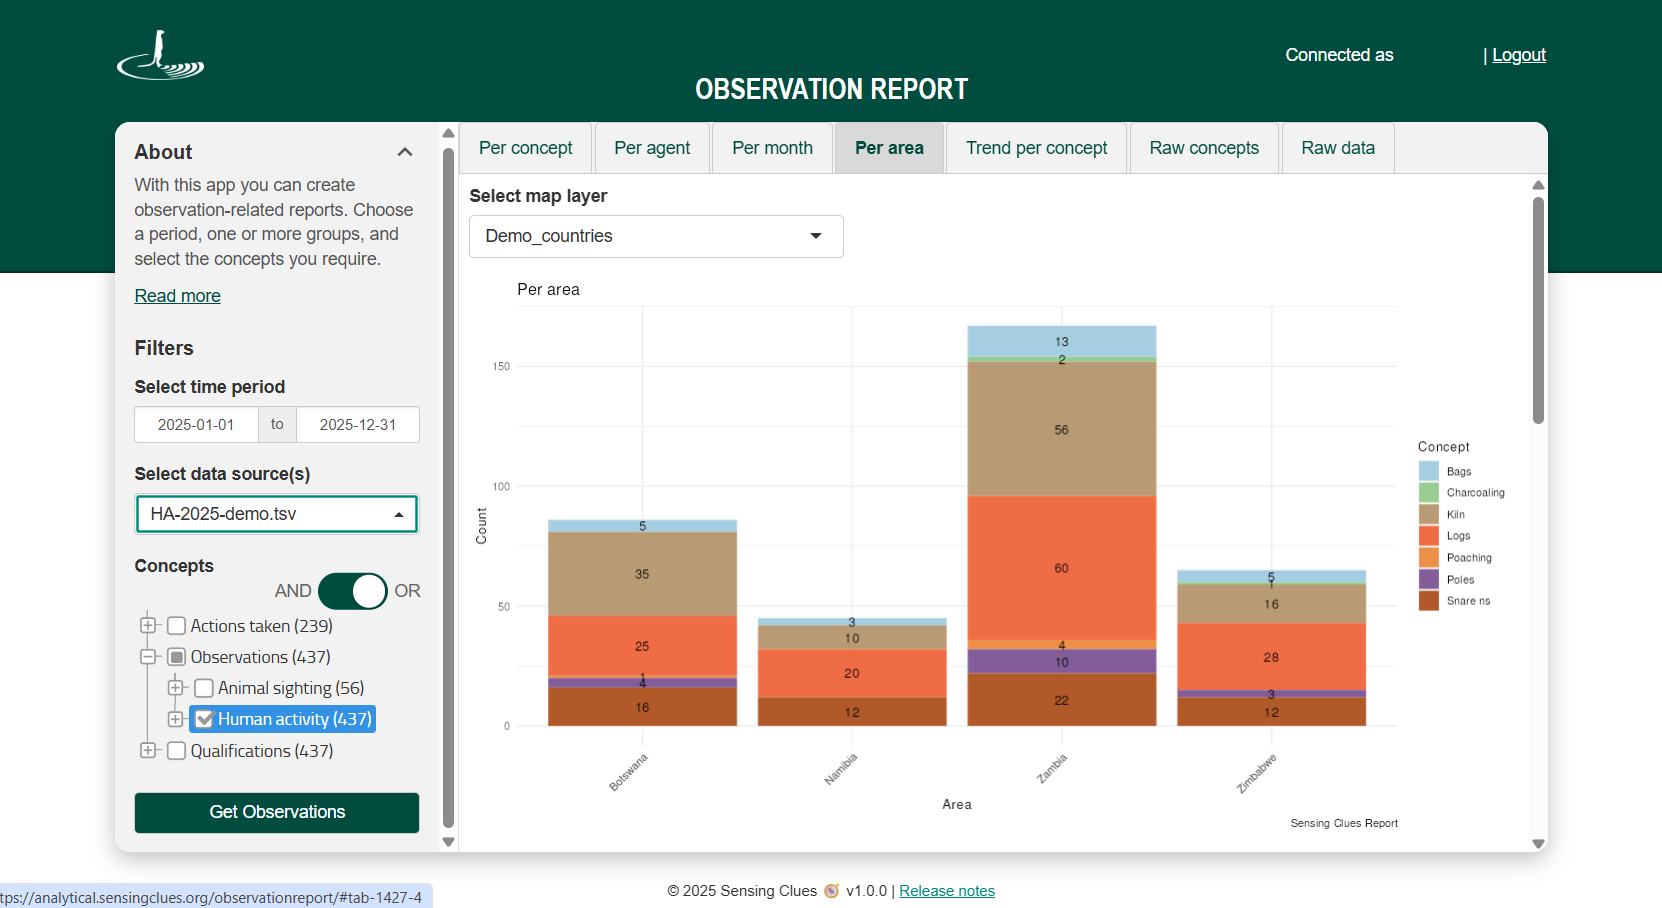
Reporting per Area
-
![]()
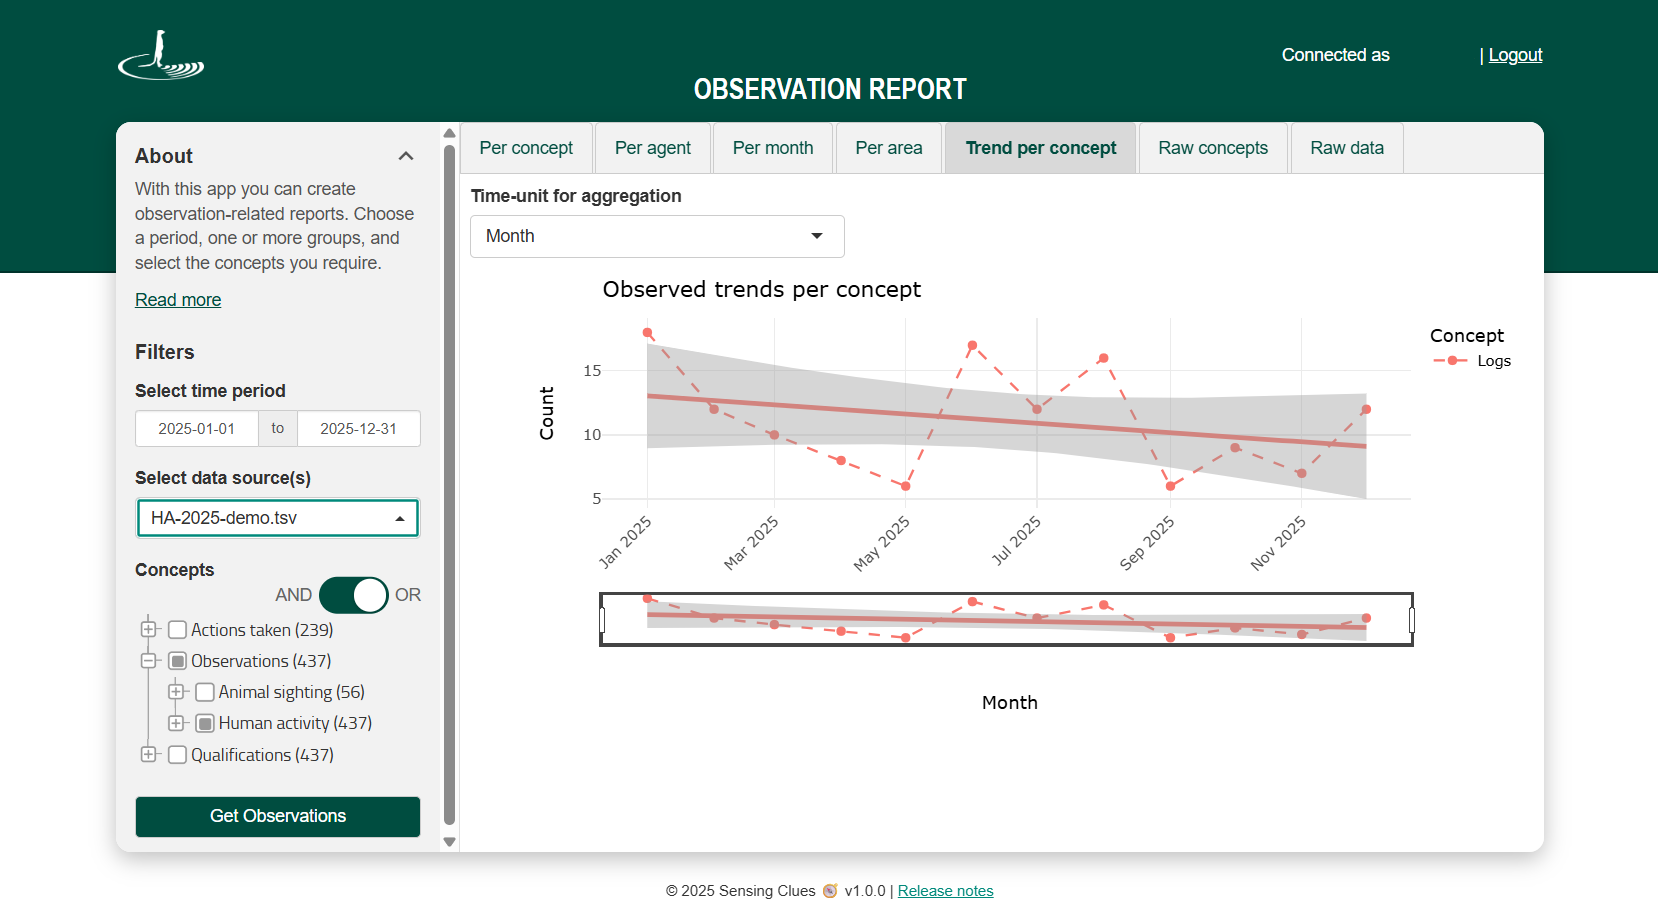
Trends
-
![]()
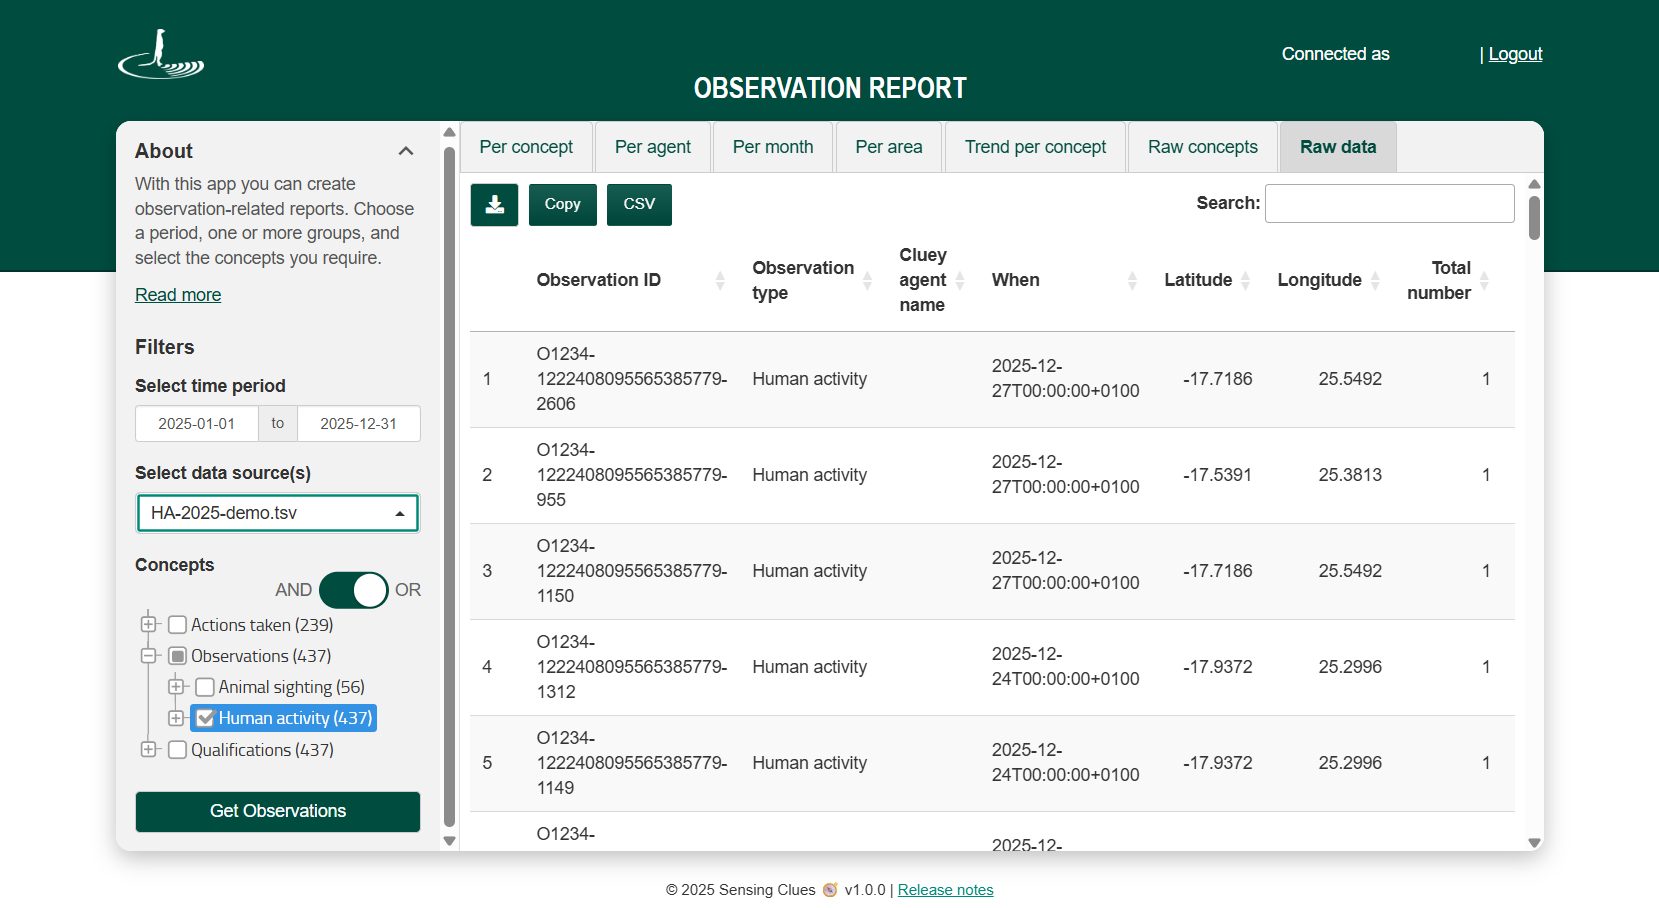
Raw Data
Key Features
View the number of recorded observations of a specific concept or any combination of concepts.
Generate reports per concept, per agent, per month, or per area (Note: Reporting per area is available to Premium subscribers with Upload Service access or permission in Central).
Track trends per concept (Note: Trends based on larger datasets are statistically more reliable.)
Create reports by data source (e.g. Cluey groups or uploaded data) or across multiple data sources.
Select any desired time period.
Download your raw data and process it in your preferred tool, such as Excel.
Reporting per Area
By uploading a GeoJSON file that defines your reporting areas — such as administrative districts, ranches, or other custom zones — you can generate reports based on those areas. Reporting per area is available to Premium subscribers only, as it requires access to the Upload Service or appropriate permissions in Central.
How it works
Log in with your Cluey credentials.
Select your time period.
Choose the data source(s) you wish to include.
Choose the concepts you wish to include.
Click “Get observations” to generate your report.
Tips & Tricks for the Raw Data Tab
The Raw Data tab displays information directly from the backend, exactly as it is stored. Hover over any column heading to see more details. You can also use Entity IDs to search and view the corresponding observation in the Focus 360 application.
To view all columns, scroll horizontally at the bottom of the table, or download the full dataset for complete access We’re currently working on a more user-friendly scrolling solution to make this easier.