

ENVIRONMENTAL TIME SERIES ANALYSIS
Monitor landscape changes with satellite data.
Visualise environmental shifts over time.
The Environmental Time Series Analysis is a powerful web app designed to support a wide range of environmental monitoring tasks. It can be used to track vegetation health, analyse land cover change, monitor burned areas, and support a range of other conservation and land management tasks. The current version of the Environmental Time Series Analysis focuses on NDVI (vegetation health) and burned areas through two main Explorers:
NDVI Explorer: Includes the NDVI Time Series, NDVI Land Cover Explorer, and NDVI Delta Map for analysing vegetation trends and spatial patterns over time.
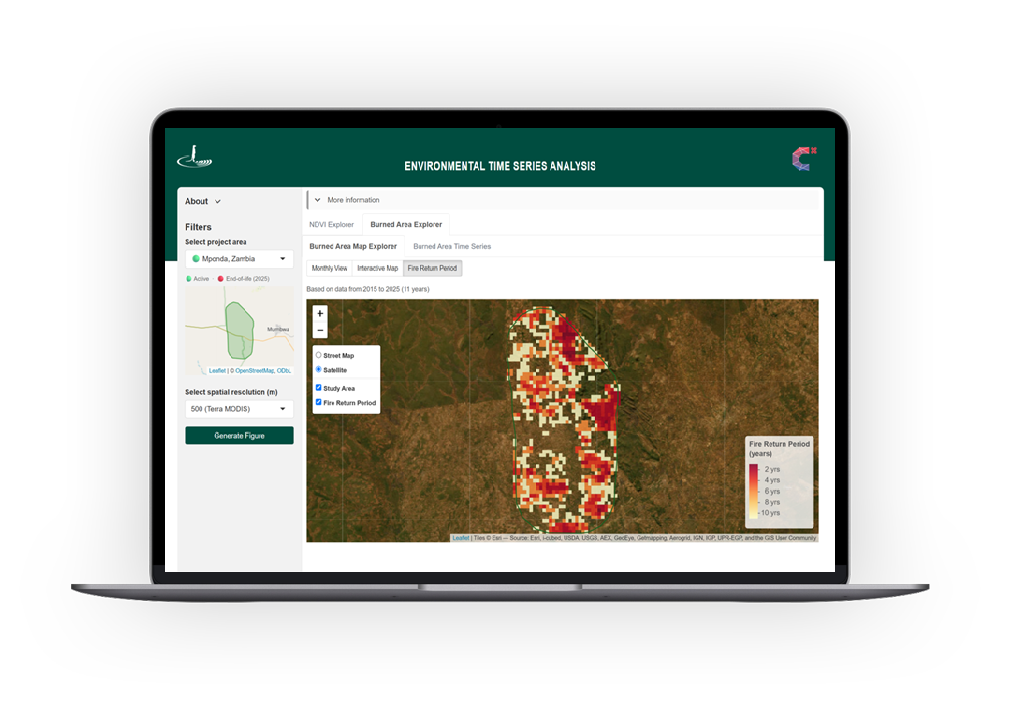
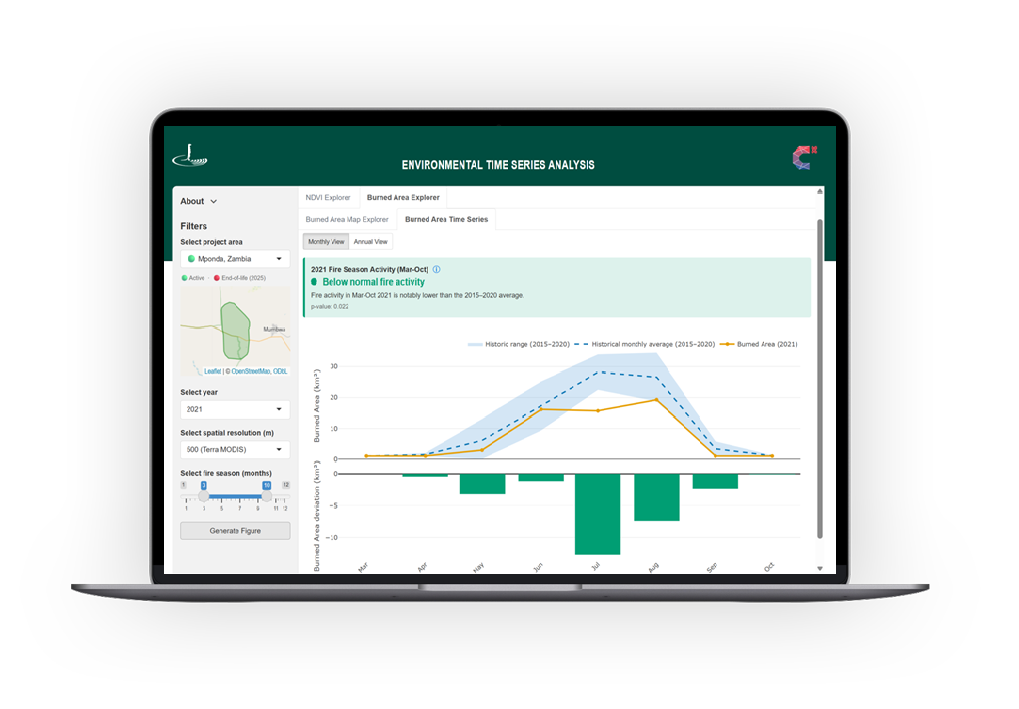
Burned Area Explorer: Includes the Burned Area Time Series and Burned Area Map Explorer for monitoring fire occurrence and burned areas across years.
NDVI, or Normalised Difference Vegetation Index, is commonly used to track changes in vegetation, particularly in protected areas.
INTERESTED IN ENVIRONMENTAL TIME SERIES ANALYSIS?
The Environmental Time Series Analysis Web App is a service that is part of our customisable Premium Plan.
UNLOCK REMOTE SENSING DATA
-
The NDVI Explorer uses the Normalised Difference Vegetation Index (NDVI) to monitor vegetation health over time. NDVI values range from −1 to 1, with higher values indicating denser, healthier vegetation and lower values indicating sparse vegetation, environmental stress, or bare surfaces. The Explorer helps users monitor vegetation patterns and changes over time.
-
The NDVI Delta Map visualises NDVI values across the selected region, allowing users to identify spatial patterns, detect anomalies, and compare vegetation conditions within the Area of Interest (AoI). The Monthly View highlights where vegetation gains and losses occurred for a selected month in comparison to the previous year. The Annual Change View highlights where vegetation gains and losses have occurred across the project area, helping users assess changes in vegetation health over time.
-
The NDVI Land Cover Explorer provides insights into average NDVI values for different land cover classes within the Area of Interest (AoI). It helps users identify which land cover classes - such as trees, crops, or rangelands - are driving observed vegetation trends and compare their seasonal dynamics over time. This visualisation is ideal for agricultural monitoring, ecosystem assessments, and climate impact studies.
-
The NDVI Time Series reveals the seasonal dynamics of vegetation health within the selected region over a 12-month period. It compares vegetation conditions in the selected year with historical trends, helping users identify seasonal patterns, long-term changes, and the impacts of environmental factors such as drought, land use change, or agricultural activity.
-
The Burned Area Explorer uses NASA Terra MODIS satellite imagery to detect burned areas and monitor fire activity over time. It helps users analyse fire patterns, identify frequently burned areas, and assess the spatial and temporal dynamics of fires within the Area of Interest (AoI).
-
The Burned Area Map Explorer displays the location and extent of burned areas, helping users identify spatial patterns, detect anomalies, and compare fire occurrence within the Area of Interest (AOI). The Monthly View helps locate fires, the Interactive Map visualises their spatial distribution, and the Fire Return Period highlights areas that experience repeated burning over time. Burned area data can also be downloaded as a GeoJSON file for use in other GIS and analysis tools.
-
The Burned Area Time Series provides insights into fire dynamics within the selected region. Use the Monthly View to compare the selected year with historical monthly trends, and the Annual View to compare burned area across years and analyse changes in the timing and extent of fires.
-
The data used in this project is derived from ESA's Sentinel-2 and NASA's Terra MODIS satellite imagery, accessed through Google Earth Engine. Sentinel-2 provides high-resolution, atmospherically corrected surface reflectance imagery, making it ideal for recent vegetation monitoring and intervention assessments. Terra MODIS offers a longer historical time series, making it well suited for long-term vegetation trend analysis.
Can't find the information you're looking for?


CREDITS
The Evironmental Times Series Analysis App was developed by CorrelAid and Sensing Clues Foundation, and piloted in Zambia at the Mponda Dam Project by By Life Connected.