
LIKELIHOOD MAP
Generate a Likelihood Map to highlight where events are most likely to occur and reduce observer bias in your data.
-
![]()
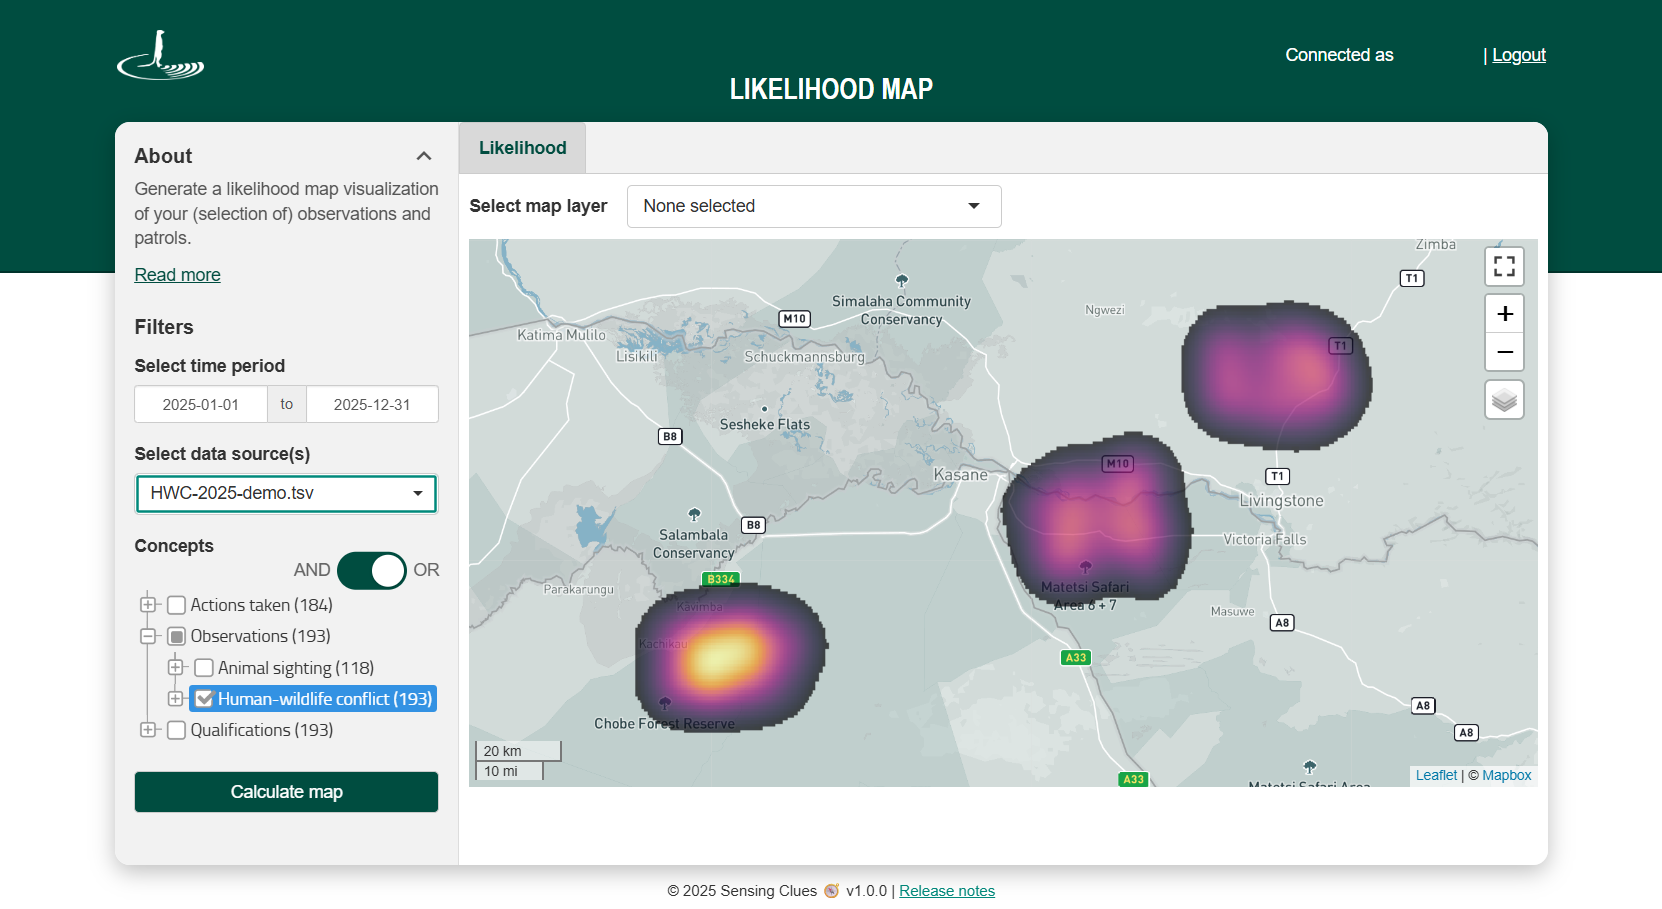
Heat Map
-
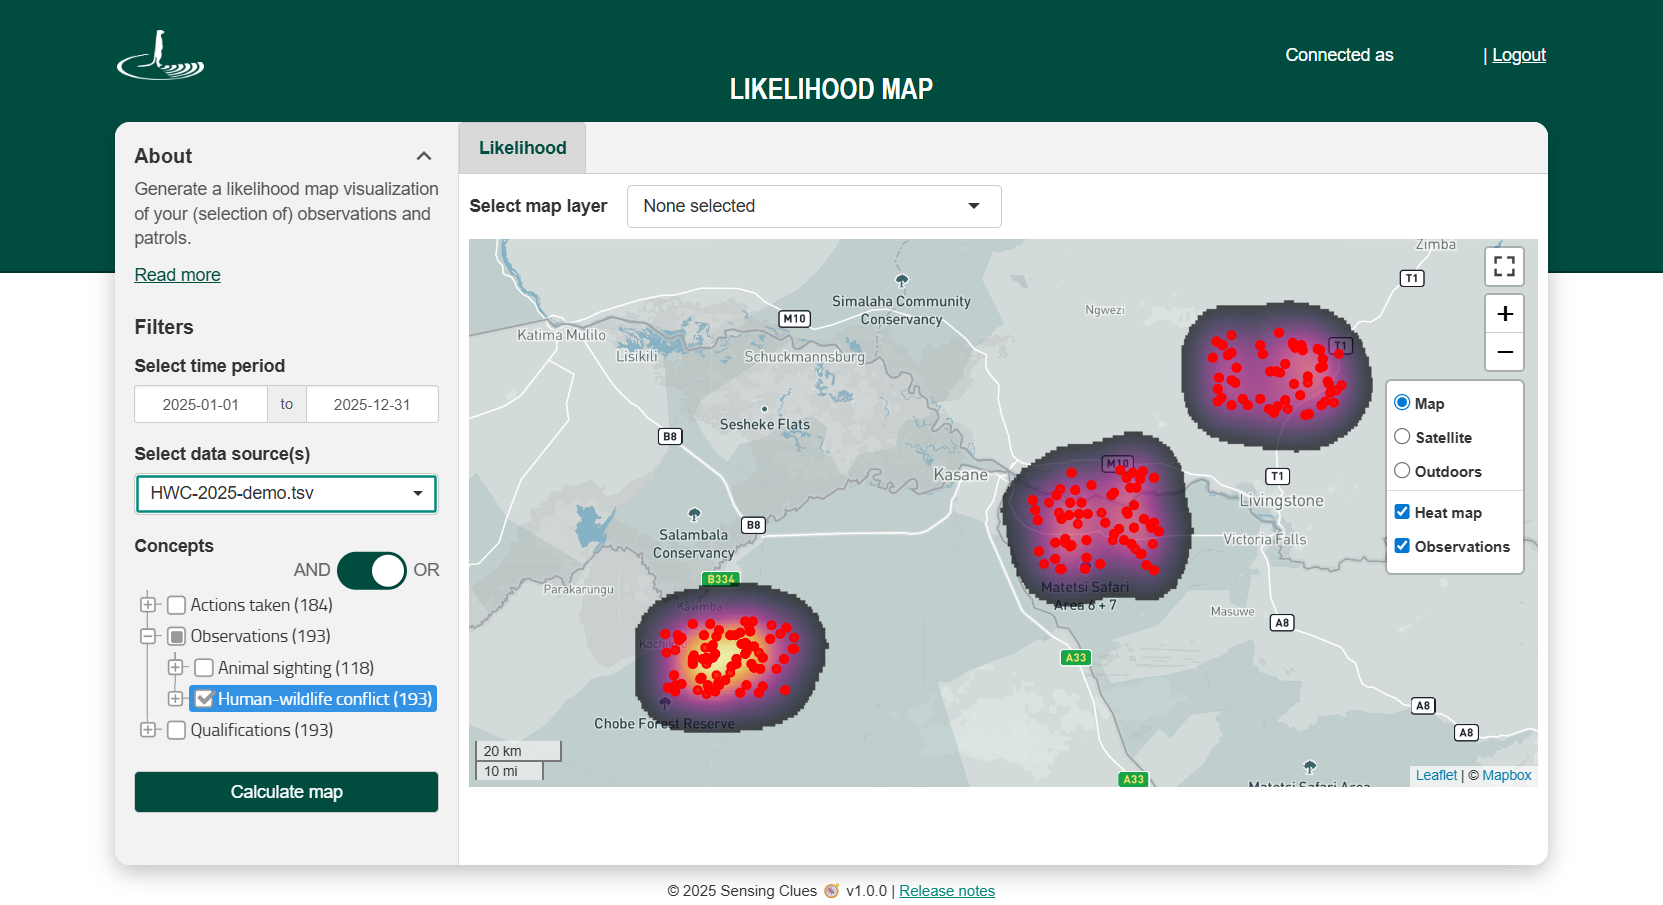
![]()
Observations Toggled On
-
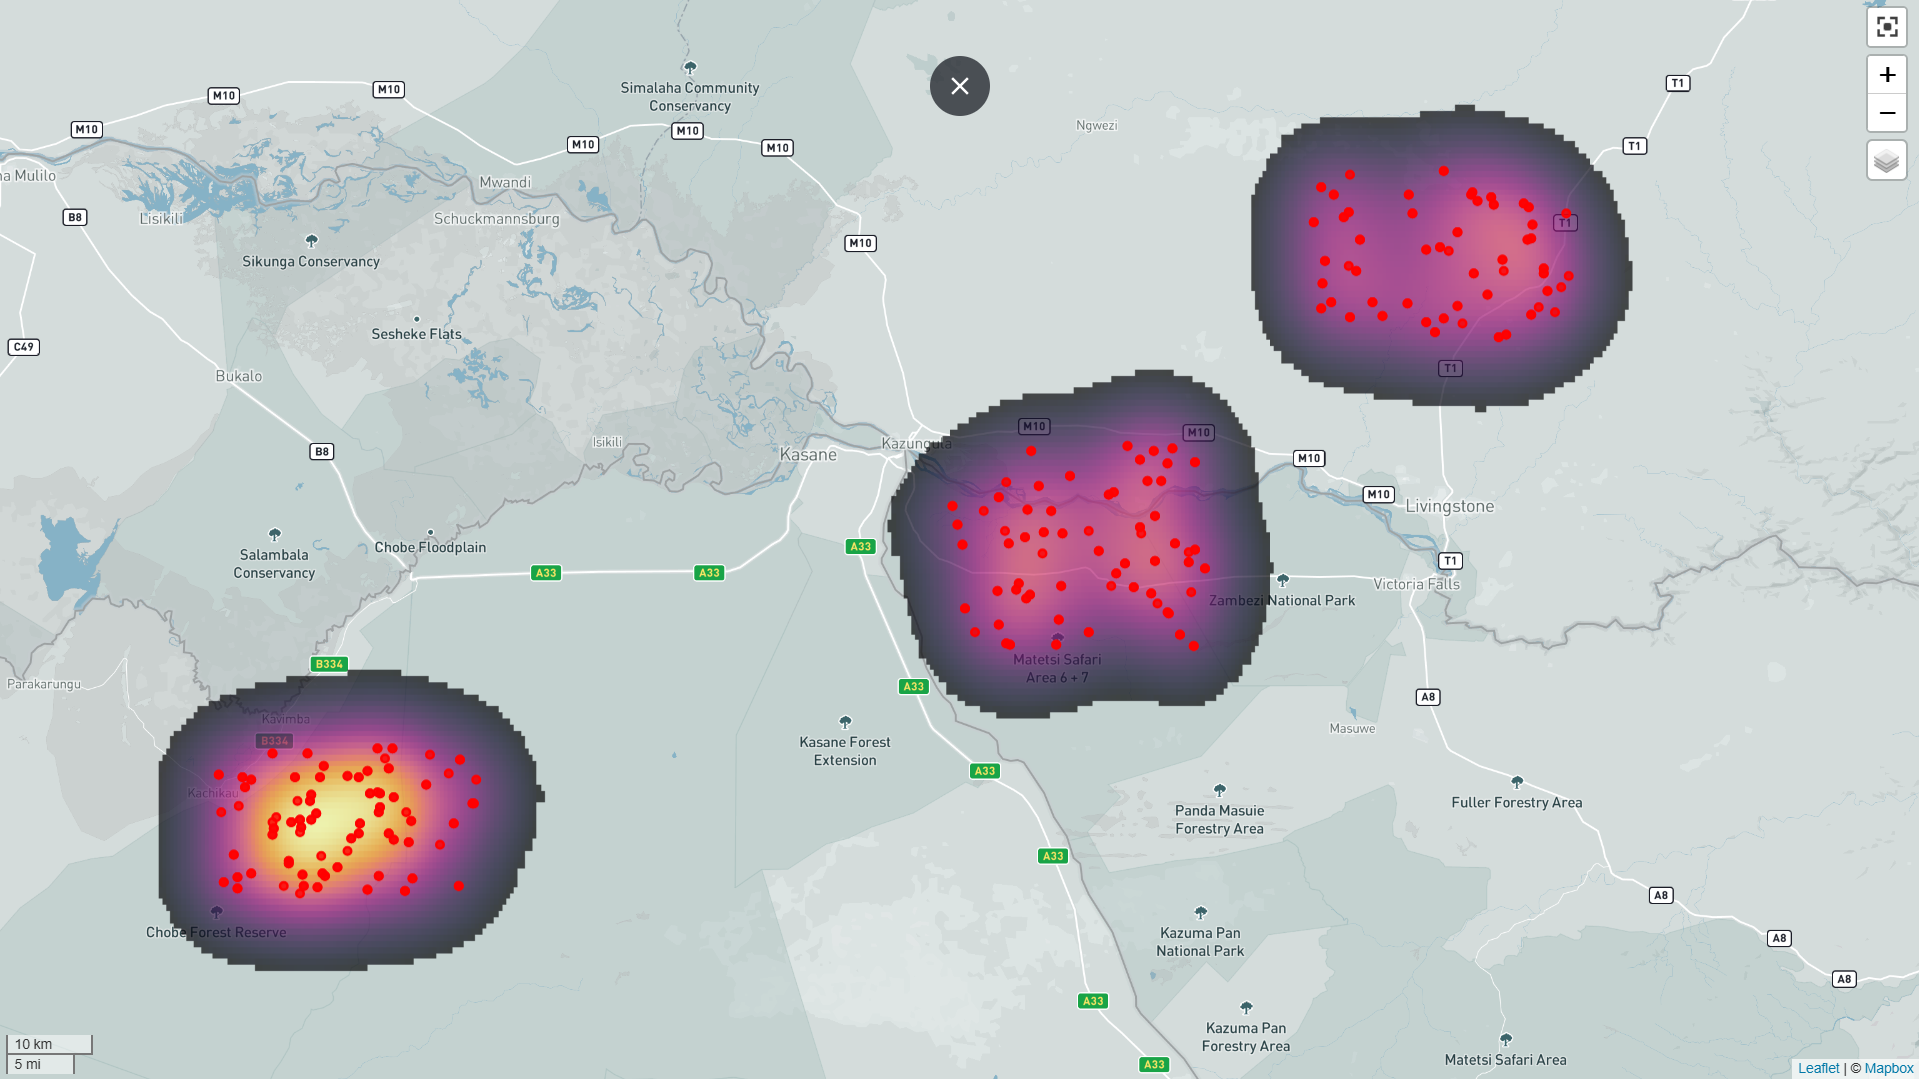
![]()
Full Screen View
-
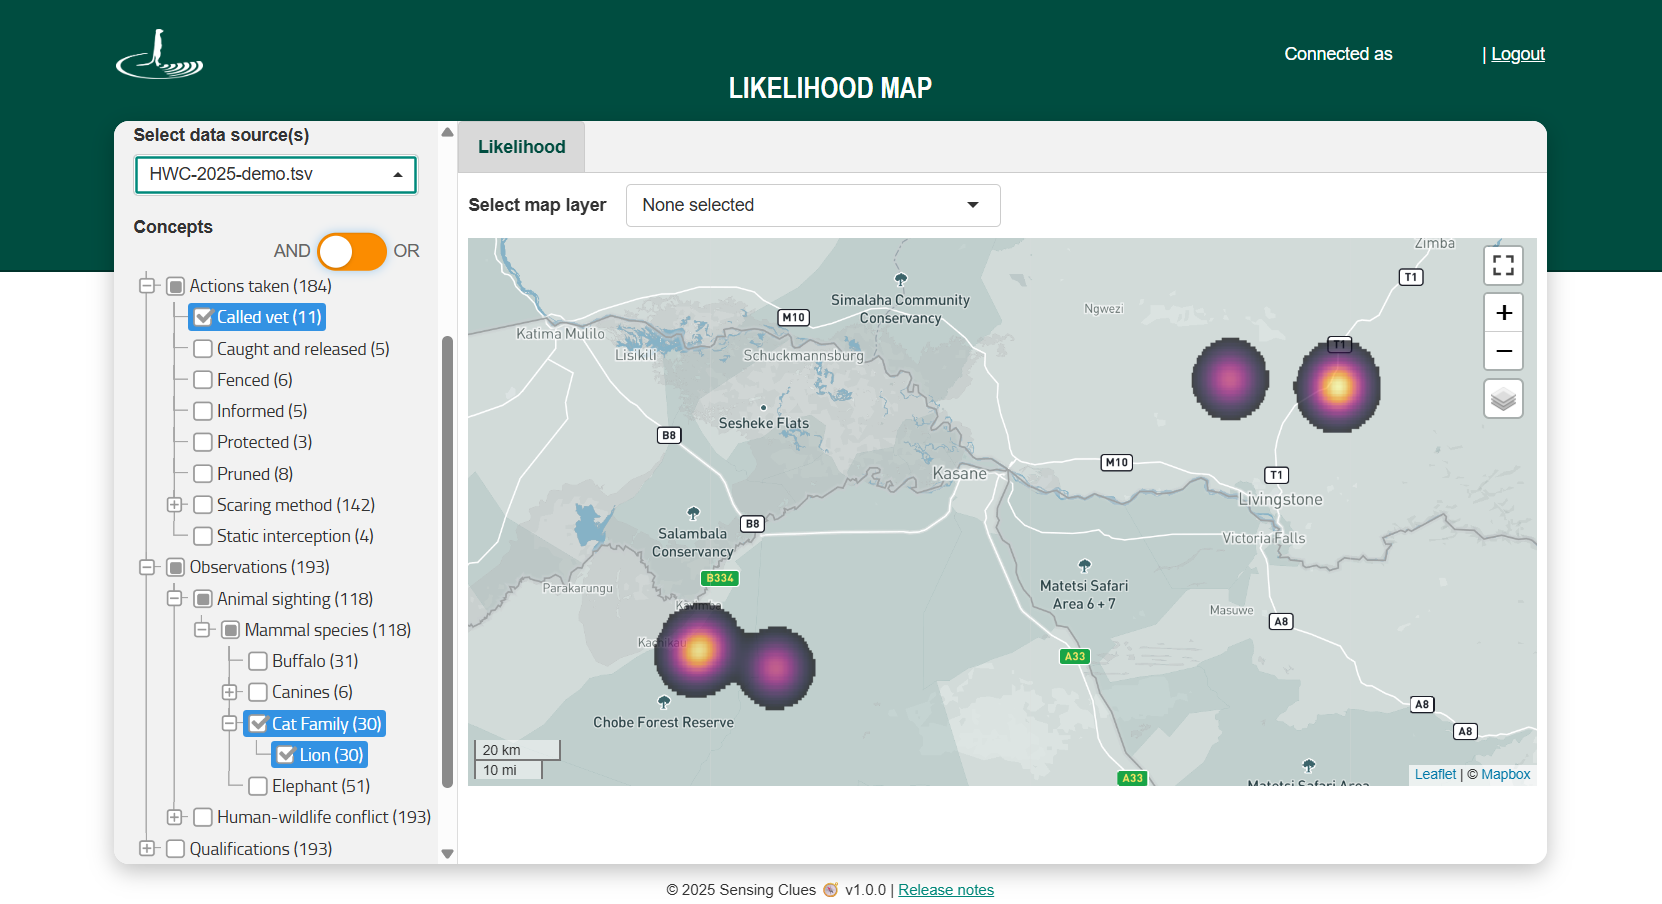
![]()
AND/OR Filtering
-
![]()
Own Map Layer
What is a Likelihood Map?
A likelihood map provides insight into the probability of finding your topic of interest within the areas you patrol.
We use your patrol effort data to neutralise observer bias, which is often present in hotspot maps (see also the Observation Map). As a result, a likelihood map offers a far more informative view for understanding risks in your landscape and for planning future patrols.
When the likelihood refers to a positive event — for example, the chance of seeing a cheetah — we call it a likelihood map. When it relates to a negative event, such as the chance of finding snares or other illegal activity, we often refer to it as a risk map instead.
Key features
Create a likelihood map for a specific concept or any combination of concepts.
Overlay your map with your own map layers (Note: Available to Premium subscribers with Upload Service access or appropriate permissions in Central).
Generate maps by data source (e.g. Cluey groups or uploaded data) or across multiple data sources.
Select any desired time period (Note: Maps based on larger datasets are statistically more reliable).
Visualisation Options
View the likelihood map with or without individual observations.
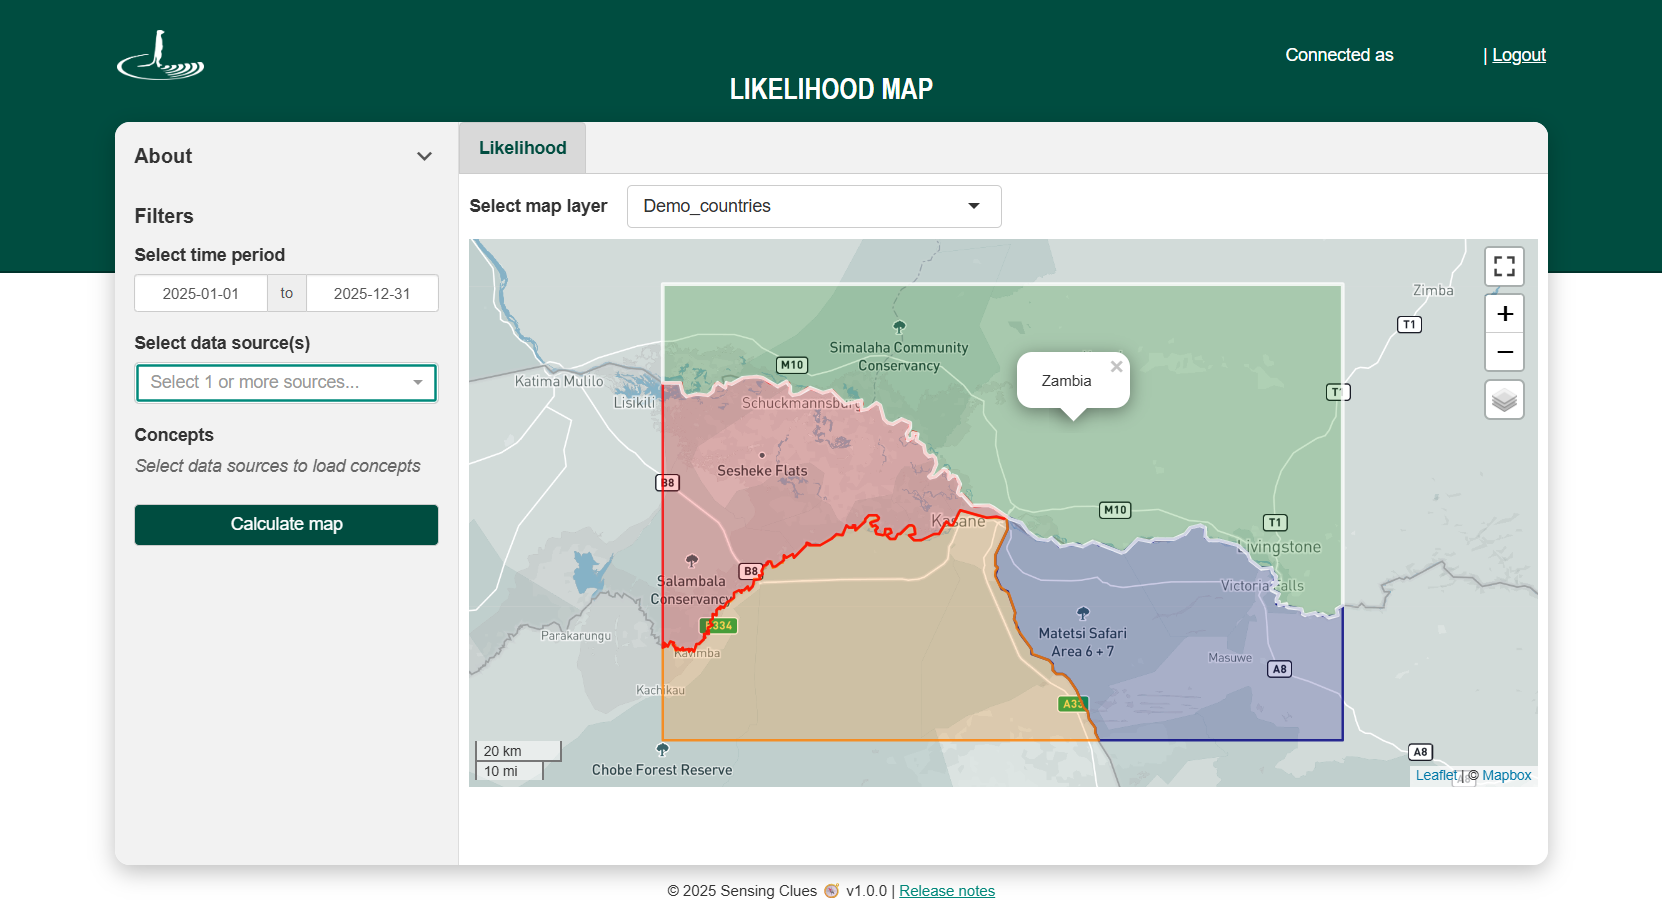
How it works
Log in with your Cluey credentials.
Select your time period.
Choose the data source(s) you wish to include.
Choose the concepts you wish to include.
Click “Calculate map” to generate your map.