
ENVIRONMENTAL TIME SERVIES ANALYSIS
The Environmental Time Series Analysis app is a monitoring tool powered by Sensing Clues and CorrelAid.
Key Features
The Environmental Time Series Analysis app is a powerful monitoring tool designed for:
Vegetation health monitoring
Deforestation analysis
Drought assessment
Land-cover classification
Built-up area expansion monitoring (NDBI)
Flood monitoring (NDWI)
Forest fire–risk analysis (NDMI)
To support these use cases, the app offers three core visualisations:
Charts – Display average NDVI values per month for a selected year.
Maps – Show monthly NDVI patterns geospatially for the same period.
Land Cover Explorer – Analyse all above metrics within specific land-cover classes.
NDVI (Normalised Difference Vegetation Index) is a widely used indicator for tracking changes in (protected) areas. Future versions of the app will support additional indices, including NDMI (moisture), NDWI (water), NDBI (built-up areas), EVI (enhanced vegetation index for dense vegetation), and more.
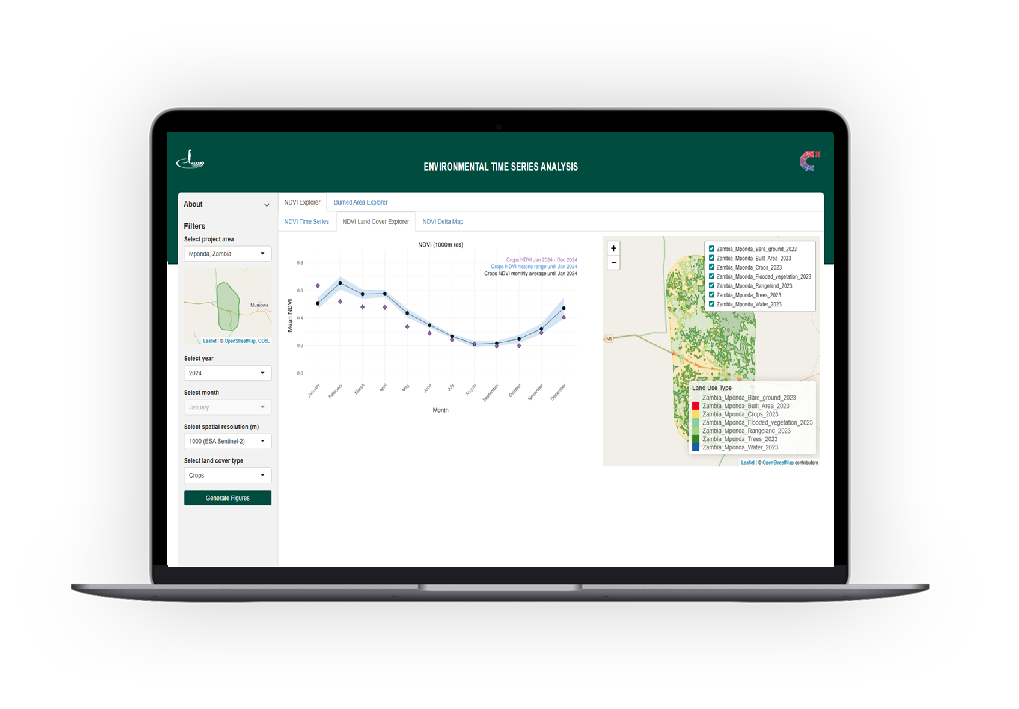
Time Series – Chart Version
The time series line chart illustrates the temporal dynamics of vegetation in the selected region over a 12-month period, highlighting trends and seasonal variations in vegetation health. Higher NDVI values generally indicate denser, healthier vegetation, while lower values may reflect sparse vegetation, stress, or land-cover changes caused by factors such as drought, deforestation, or agricultural activity.
To generate the chart, simply select a country, month, and year. The system will process the NDVI values for the chosen area and display the corresponding time-series visualisation, enabling clear interpretation and comparison across different time periods.
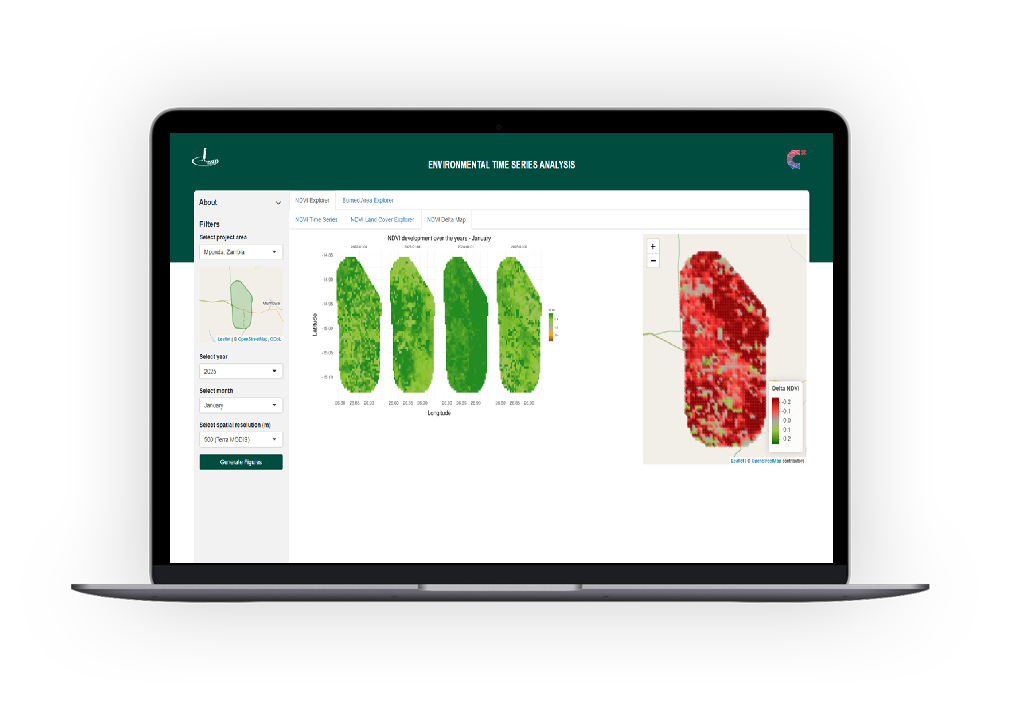
Time Series – Map Version
The map series provides a spatial representation of NDVI values across the selected region, with each pixel showing the NDVI value at its corresponding geographic location. This visualisation enables users to identify spatial patterns in vegetation health, detect localised anomalies, and compare NDVI values across different areas within the Area of Interest (AoI).
In addition to absolute NDVI values, users can compute Delta NDVI, which represents the difference between the NDVI of the current month and that of the same month in previous years. The Delta NDVI heatmap highlights areas where vegetation health has improved or declined compared with historical averages.
To generate the map series, simply select a country, month, and year. The system will process the NDVI values and, if requested, calculate the Delta NDVI to reveal how vegetation conditions have changed relative to past data.
Land Cover Explorer
The Land-Cover Explorer provides insights into NDVI values averaged across a selected area for a specific land-cover type. It enables users to observe how NDVI varies throughout the year, highlighting patterns such as peaks during growing seasons and declines during dry or dormant periods. This makes the tool particularly useful for agricultural monitoring, ecosystem assessments, and climate impact studies.
To generate a chart, simply select a country, month, year, and land-cover class. The system will process the NDVI values for the chosen area and display them in a clear time-series visualisation.
DATA COLLECTION & PRE-PROCESSING
Data Sources
The NDVI data used in this project is derived from Sentinel-2 satellite imagery, specifically the “COPERNICUS/S2_SR_HARMONISED” dataset accessed via Google Earth Engine (GEE). This dataset provides atmospherically corrected surface reflectance imagery, making it highly suitable for vegetation monitoring and environmental analysis.
Area of Interest (AoI) & Time Period
The Area of Interest (AoI) is defined using asset files stored within GEE. Data collection is carried out over a user-specified time period, with a minimum granularity of one month. This enables consistent temporal comparisons and reliable trend detection.
Data Pre-processing Steps
Sentinel-2 surface reflectance images were filtered according to the AoI and selected date range.
Cloud and other unwanted pixels were masked using the Scene Classification Layer (SCL) band.
NDVI was calculated for each image using the formula: NDVI = (B8 – B4) / (B8 + B4) where B8 represents the near-infrared (NIR) band (vegetation reflectance) and B4 represents the red band (vegetation absorption).
A mosaic operation was performed to generate a composite NDVI image for each month. This composite captures the best available NDVI values, minimising the impact of cloud cover and low-quality observations.
Data Export
The monthly NDVI composite images were exported to Google Drive, clipped to the AoI, and saved using the defined spatial resolution and coordinate reference system (CRS). Exported filenames include both the processing month and the country name to facilitate easy identification.
Credits
This app has been developed by CorrelAid and Sensing Clues, and piloted in Zambia within the Mponda project of By Life Connected.