
INTRODUCING THE BURNED AREA EXPLORER
Insights from Volunteer Mitchell Boer
We are excited to announce the addition of the Burned Area Explorer to our Environmental Time Series Analysis. This new tool allows users to track how burned areas have changed over time and explore detailed maps showing their location and extent. It’s a powerful way to monitor environmental changes and support conservation efforts.
To celebrate this milestone, we sat down with Mitchell Boer, a dedicated Sensing Clues volunteer who helped develop this feature. Here are five questions highlighting his insights and contributions.
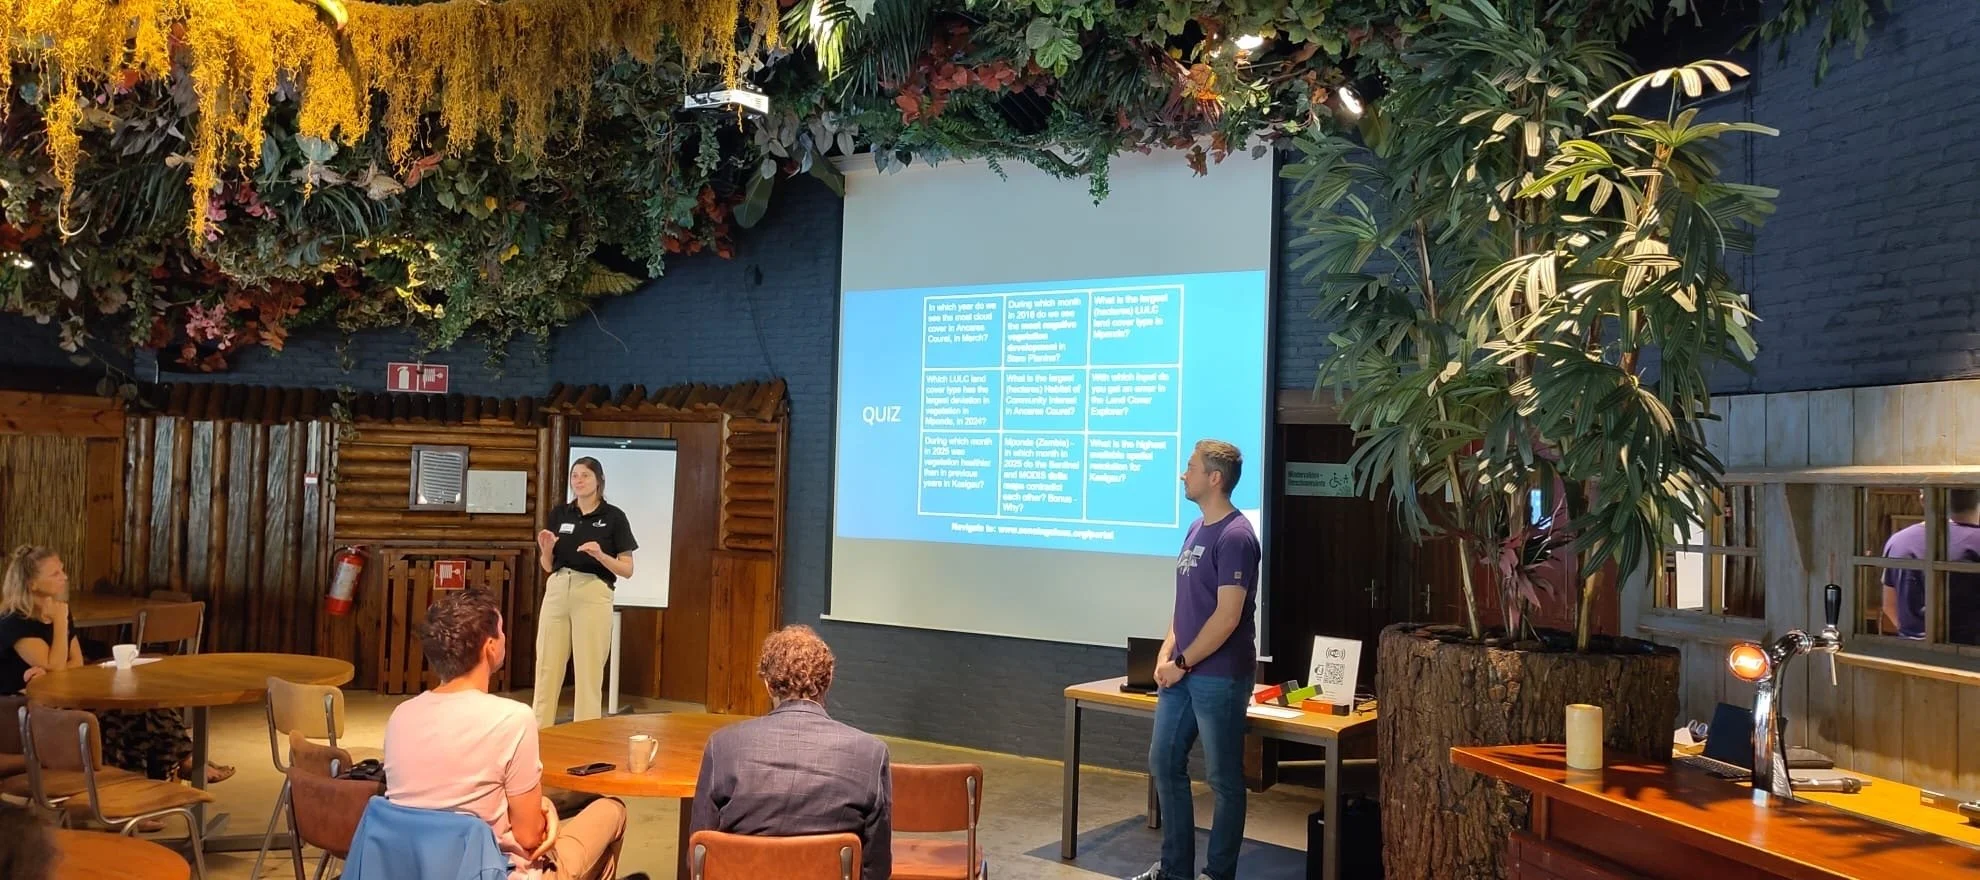
Mitchell & Melanie presenting the Environmental Time Series Analysis at the Nature FRST Conference in June 2025.
1. Mitchell, what inspired you to volunteer for Sensing Clues?
After having worked for several years as a data specialist at large corporates, I decided last year that I want to start using my skills to support wildlife and nature conservation efforts. I enrolled in a master’s program in ecology, and about a month after starting, a friend pointed out the call for volunteers for the CorrelAid Netherlands project with Sensing Clues: the Environmental Time Series Analysis. No better way to start applying what I’m learning straight away. I really liked the collaboration with Sensing Clues during the project, especially the enthusiasm and support we received as volunteers along the journey. As I firmly believe in Sensing Clues’ mission and really felt at home working with the team, I was happy to stay on as a volunteer after the project ended.
2. How did the Environmental Time Series Analysis get started?
The Environmental Time Series Analysis began as a collaboration and co-development between a group of data enthusiasts via CorrelAid Netherlands and Sensing Clues. Landowners and managers know best what’s happening with the vegetation in their area as they see it changing around them every day. However, it’s much more difficult to quantify whether land management practices and restoration efforts have a positive effect when standing in the field. With the Environmental Time Series Analysis, we use satellite images to track NDVI (a measure of vegetation health) over time and areas as a whole. This immediately shows whether restoration efforts are having an effect — and, if not, where action is needed. After two months the first prototype of the application was finished, and over time I’ve been adding user experience improvements and additional functionality, such as the Burned Area Explorer.
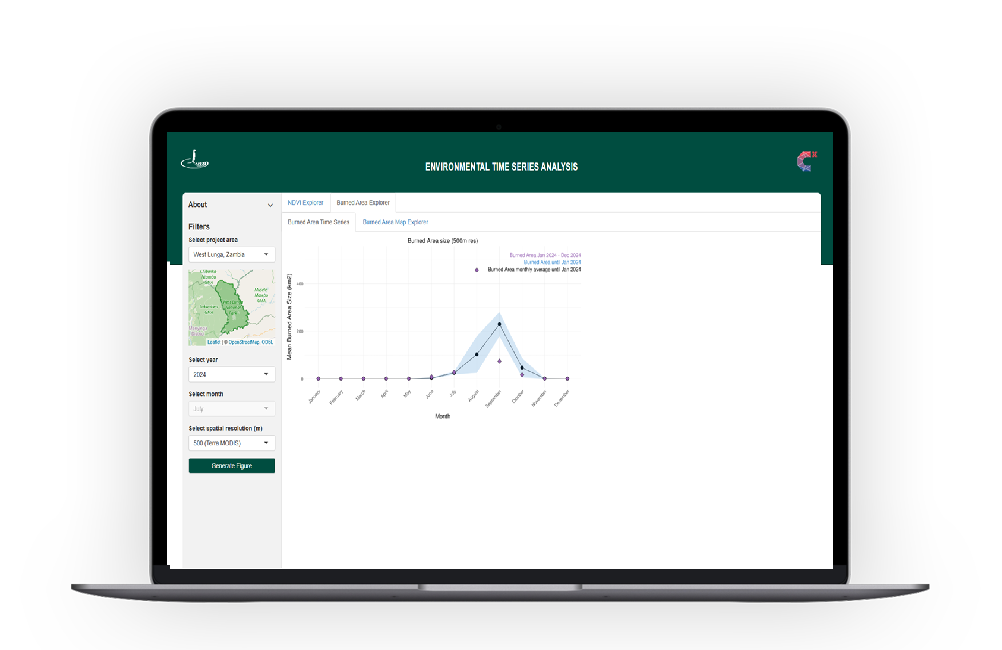
The Burned Area Time Series shows trends in a graph.
3. Why did you add the Burned Area Explorer?
Inspired by one of Sensing Clues’ partners, By Life Connected, Jan-Kees asked whether we were familiar with the so-called burn scars (blackened land surface after fires) in one of our weekly Conservation Innovation Hub calls. This sounded very similar to the Environmental Time Series Analysis challenges we had tackled just a few months before, so I decided to dig into it and see what was possible for a quick analysis. It turned out that I could re-use a lot of the Environmental Time Series Analysis infrastructure we’d built previously, so I decided to add it as a new feature straight away. That way, the information is immediately accessible and can be scaled up to new areas.
4. What’s unique about this tool, and how can it help conservation efforts?
From an ecological perspective, large-scale fires can have a major impact on ecosystem functioning and species composition. Therefore, informed fire management practices are an essential part of land management when these fires occur regularly. Similarly to vegetation health, effective conservation, management, and restoration start with knowing what you’re talking about before you act. The Burned Area Explorer and the Environmental Time Series Analysis tool as a whole help partners identify the status of their land, pinpoint risks and opportunities, and report on the effectiveness of their conservation efforts. Having these functionalities in one place, as well as being able to export burned areas to analyse in more specialised tools, is really the added value of this application.
5. What’s next for the Environmental Time Series Analysis?
I’m currently ironing out the last creases to make sure that the tool is as user-friendly as possible. Moreover, as nature is inherently complex, we’re also looking at adding new sources of information on landscape health, such as water, built areas, and different land cover types. That way, Sensing Clues can provide partners with a comprehensive set of indicators to monitor landscape health and change over time.
Background Information
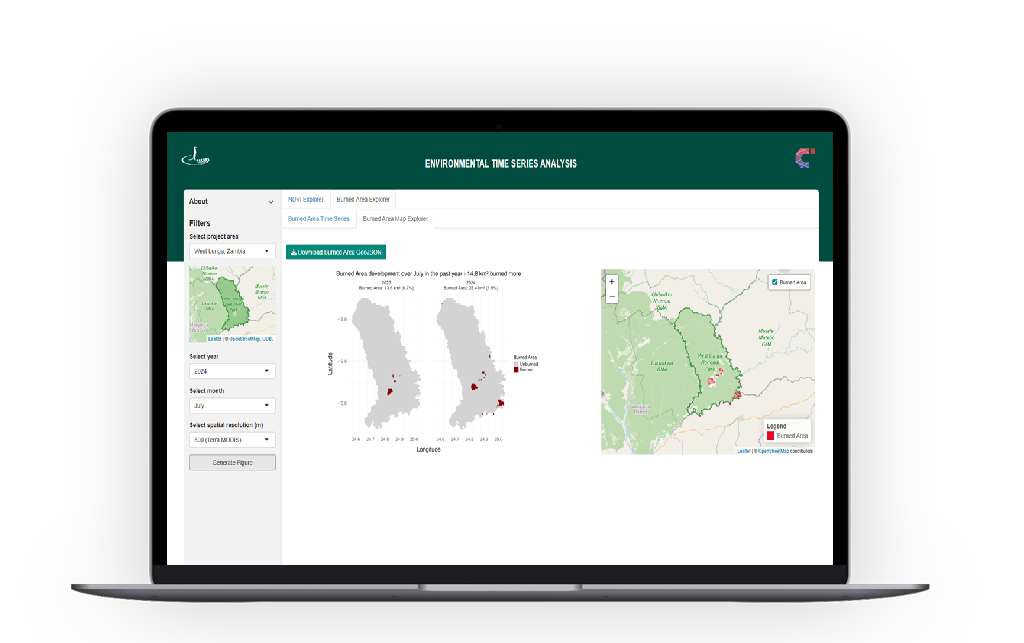
The Burned Area Map Explorer displays the location and extent of burned areas.
The Environmental Time Series Analysis is a web app designed to monitor environmental changes using satellite data. Its current version focuses on NDVI (vegetation health) and burned areas, with tools such as the NDVI Explorer, NDVI Delta Map, and the new Burned Area Explorer. Future updates will include additional indices such as NDMI, NDWI, NDBI, and EVI.
The Burned Area Explorer allows users to visualise trends, compare monthly and yearly burned areas, and download GeoJSON files for further analysis. This tool is ideal for conservationists, researchers, and anyone interested in monitoring environmental change.
The Environmental Time Series Analysis and the Burned Area Explorer are services that are part of the Sensing Clues Project Pricing Plan.