
FROM USER FEEDBACK TO A BETTER CRANE MIGRATION RADAR
Live Hackathon on 28 August 2026
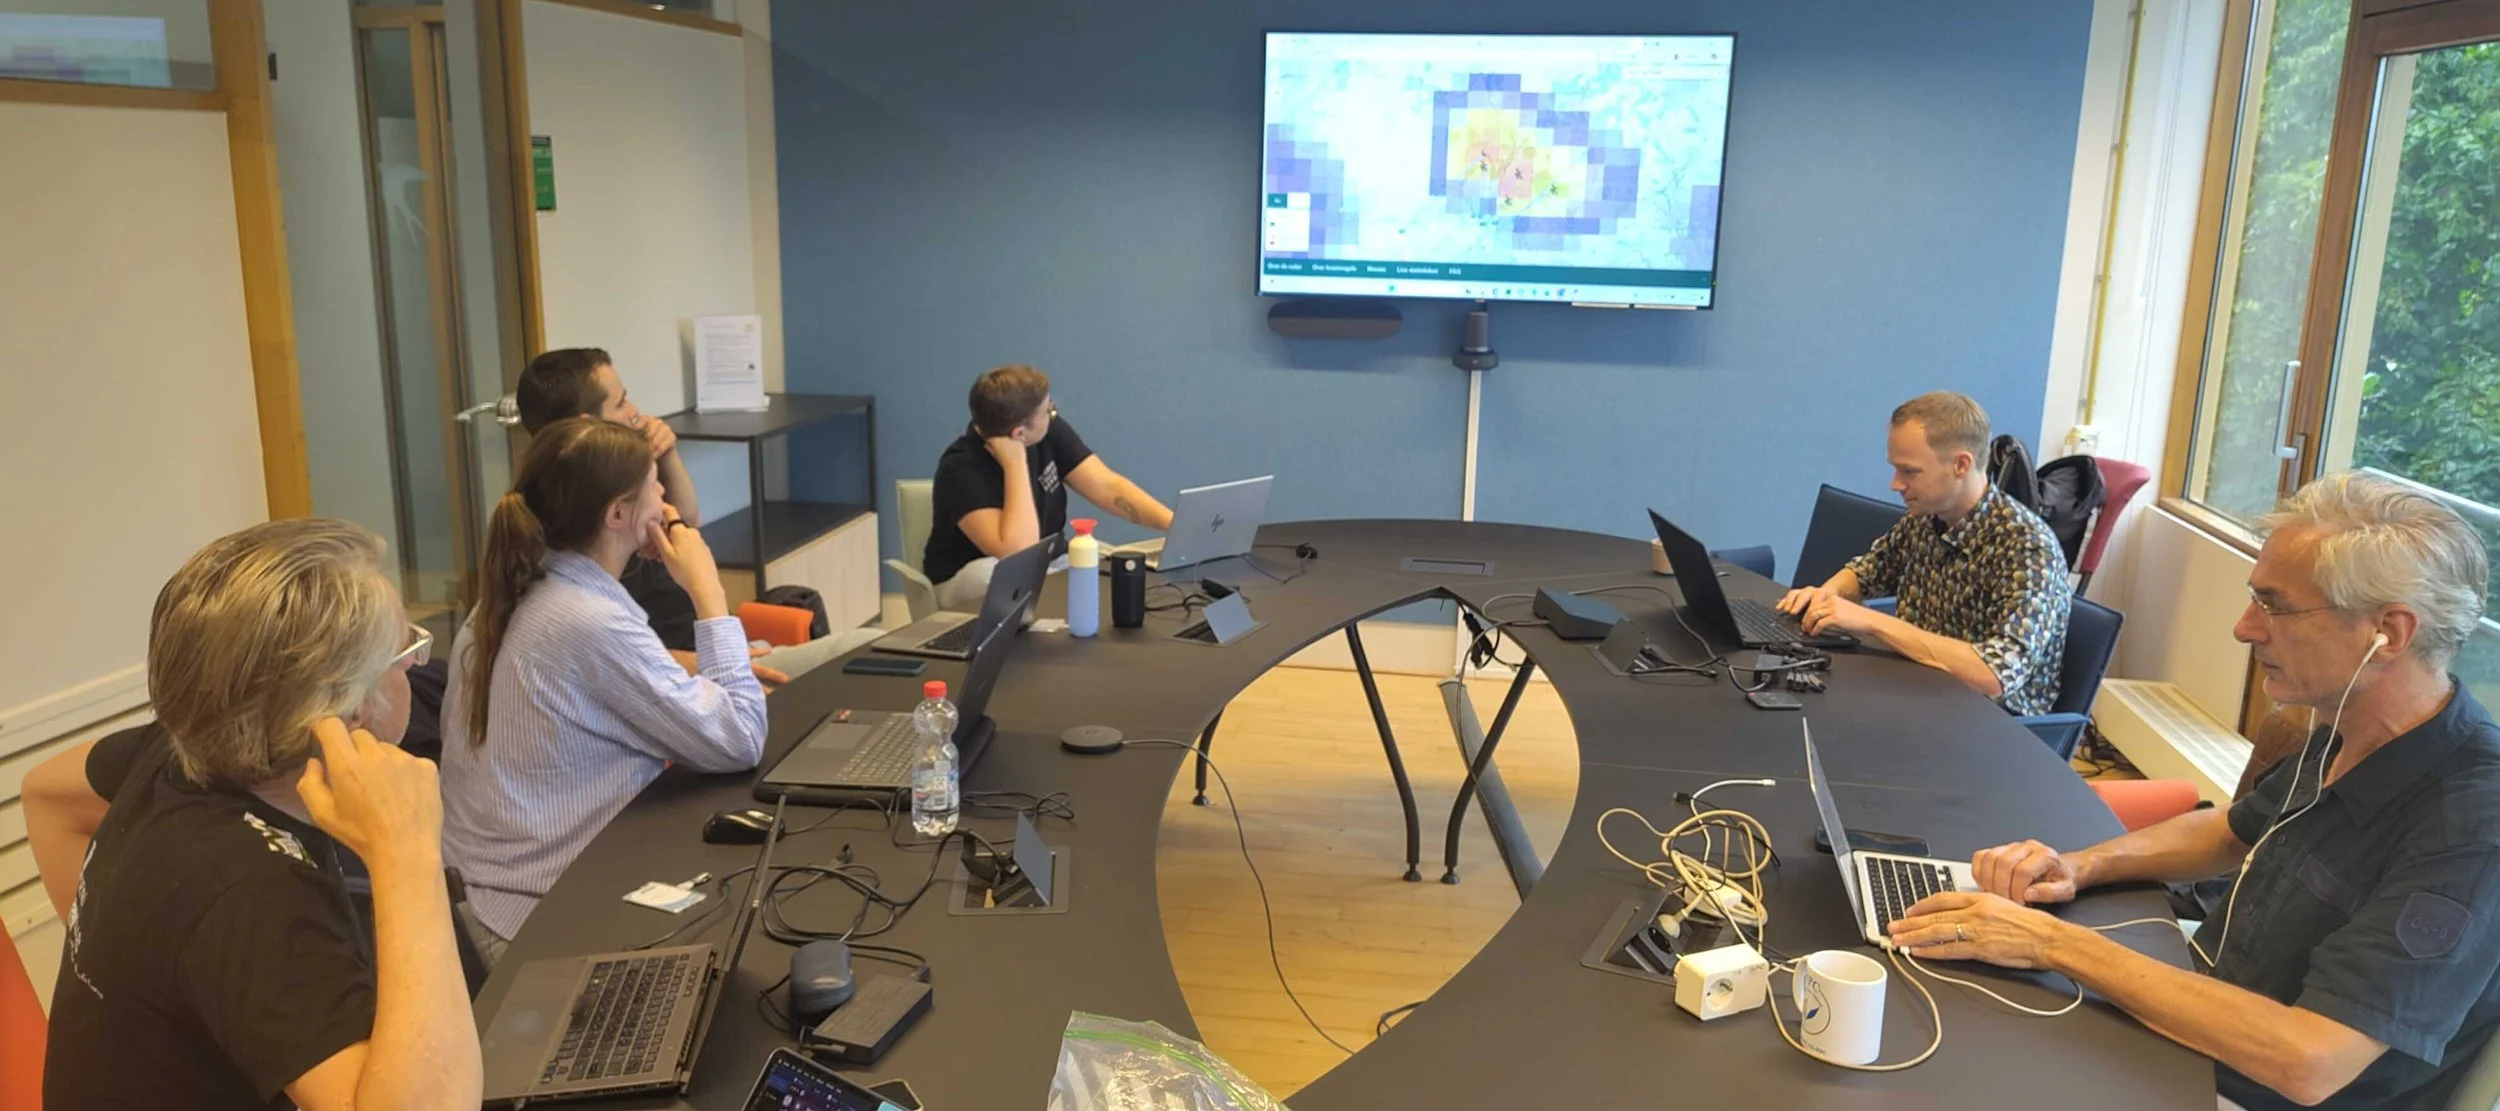
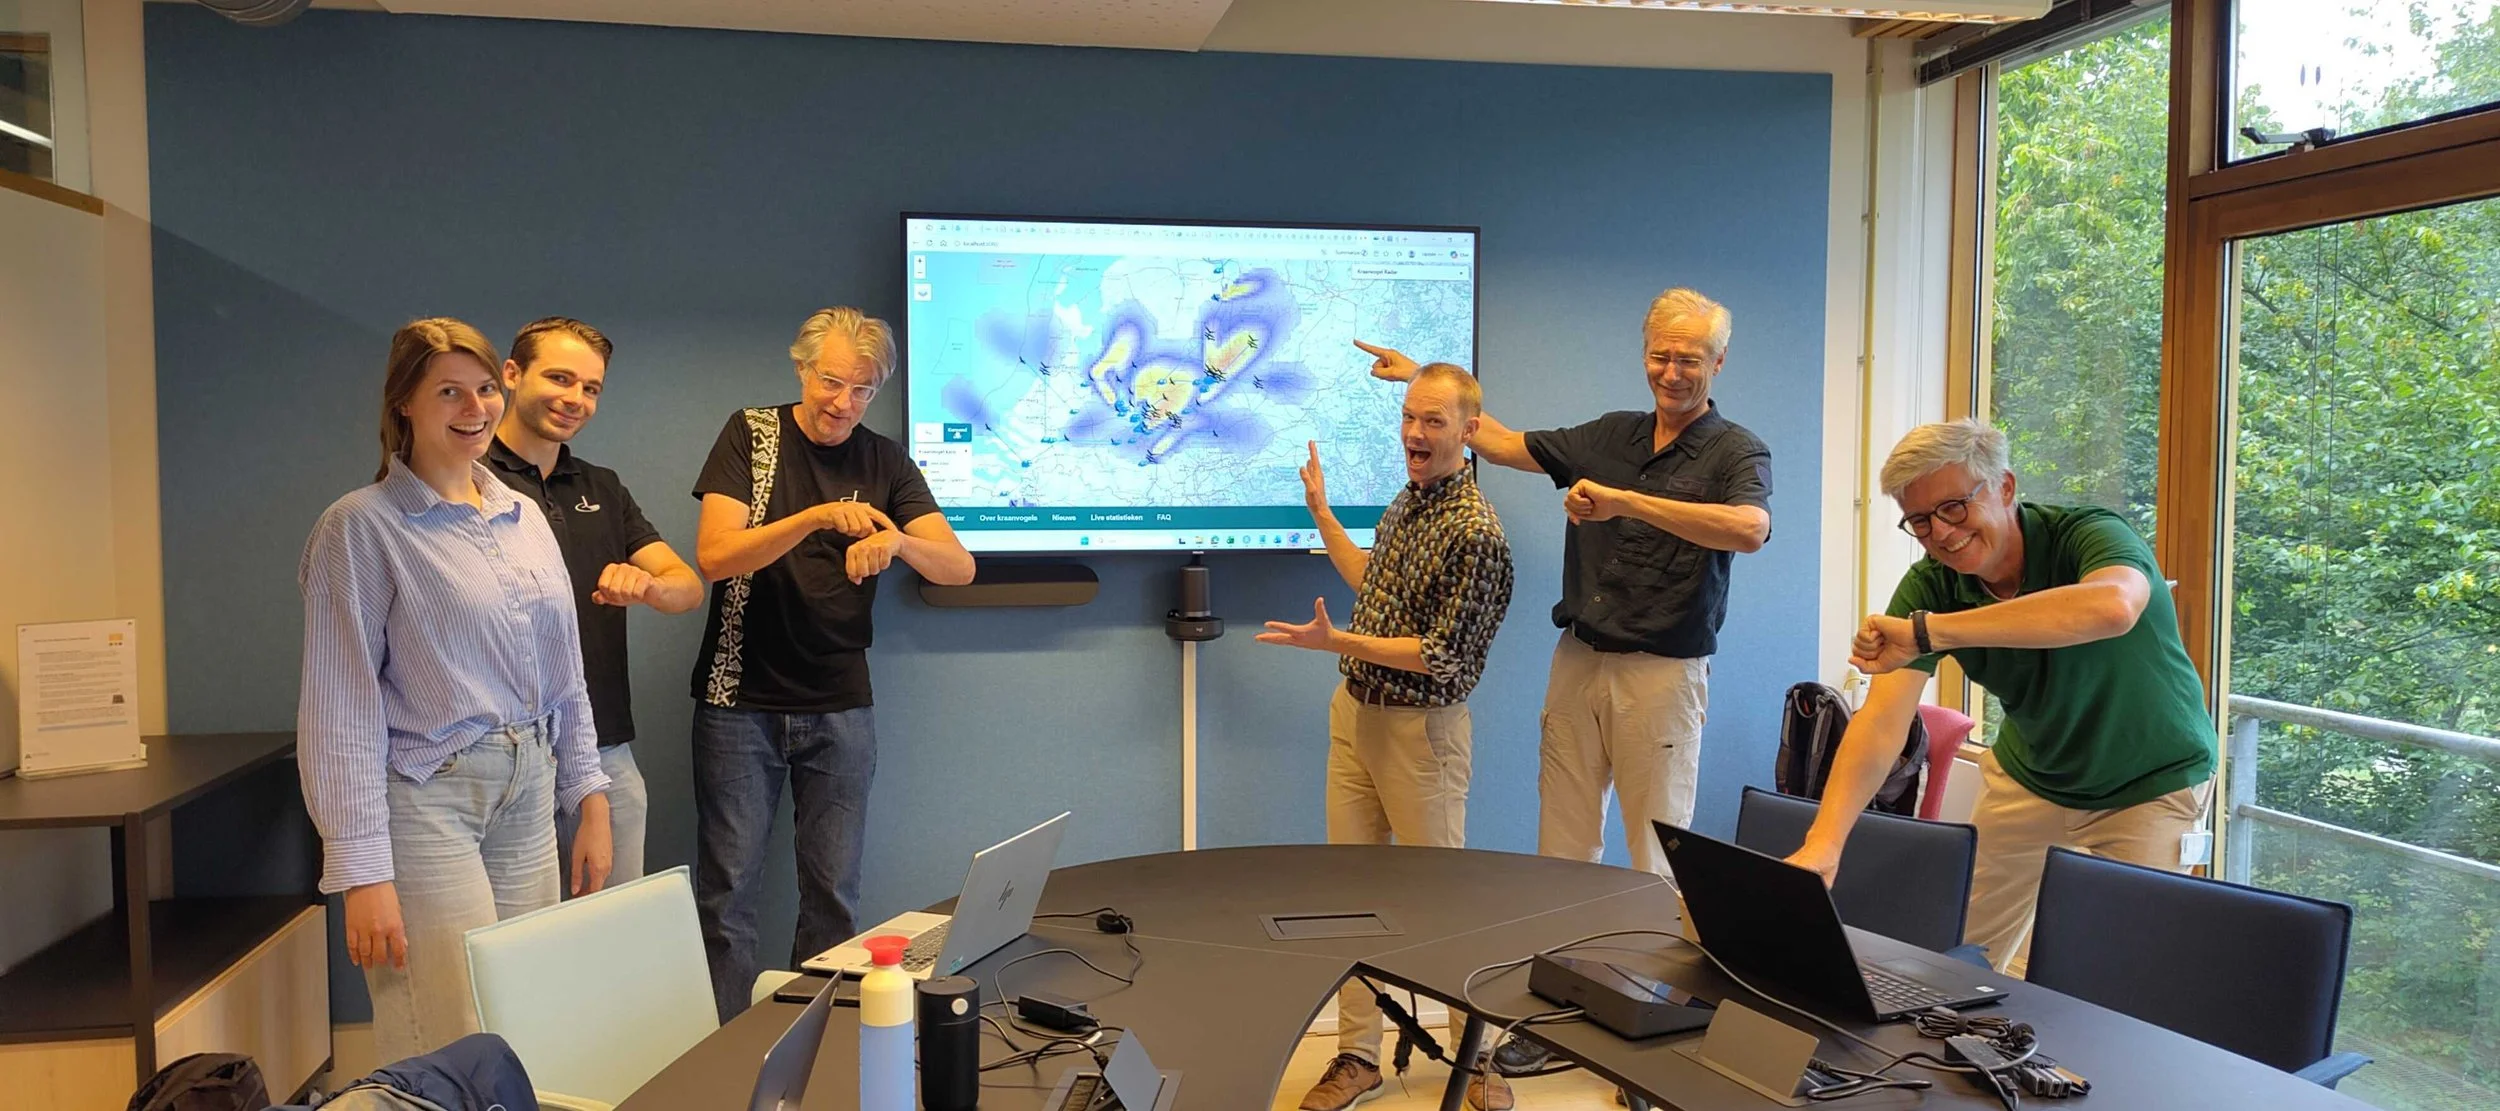
On Friday, 28 August, the Sensing Clues team came together at Wageningen University & Research for another focused hackathon dedicated to the future of the Crane Radar. Melanie, Bas, Hugo, Koen, Jan-Kees, Menno and Sanne spent the day turning feedback from Crane Radar users into concrete improvements — with the next crane migration in October already in sight.
From user requests to real improvements
The work builds on the Crane Radar co-creation session held on 14 March at Jachtslot Mookerheide. One request stood out in particular: users wanted to know where the cranes would be in the near future, not only where they are right now. For people living further away from the migration routes, this makes a big difference. If you want to travel somewhere to see the cranes, you need time to plan. The team therefore focused on making the Crane Radar more useful not only for following migration, but also for planning when and where to watch.
Looking one hour ahead
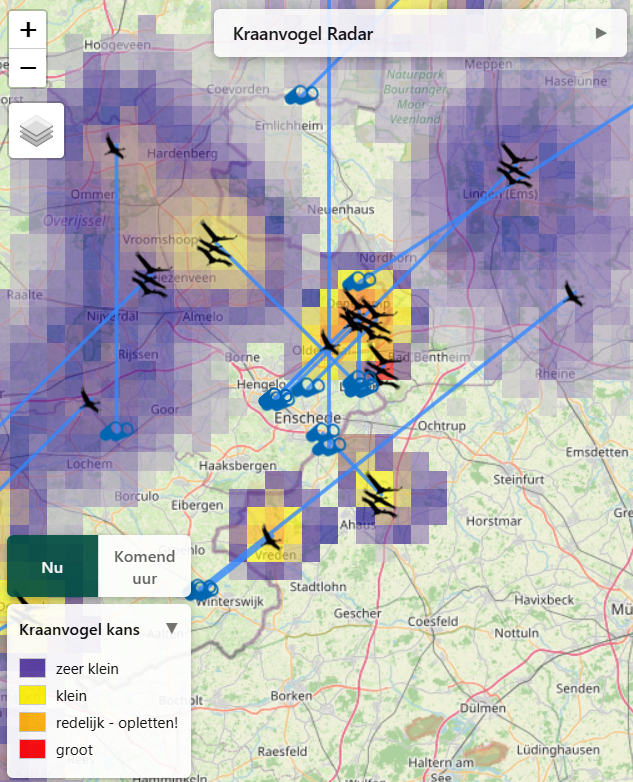
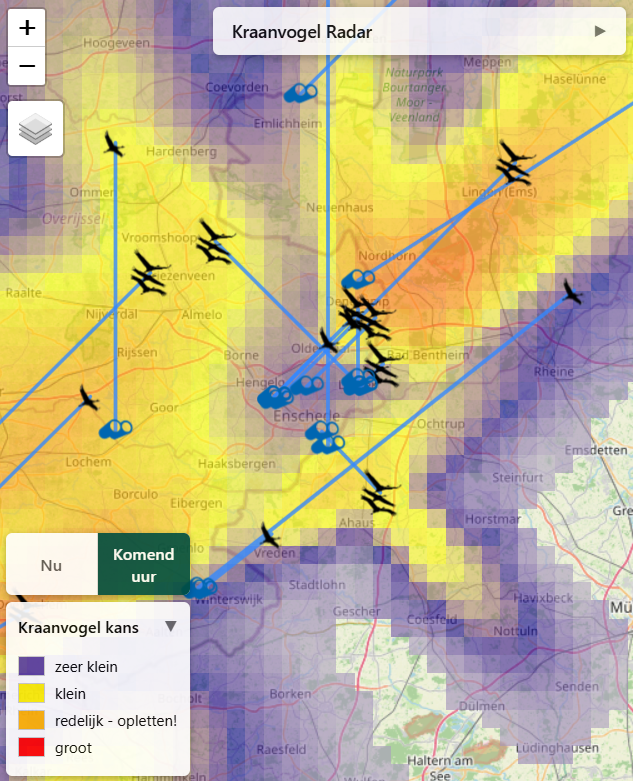
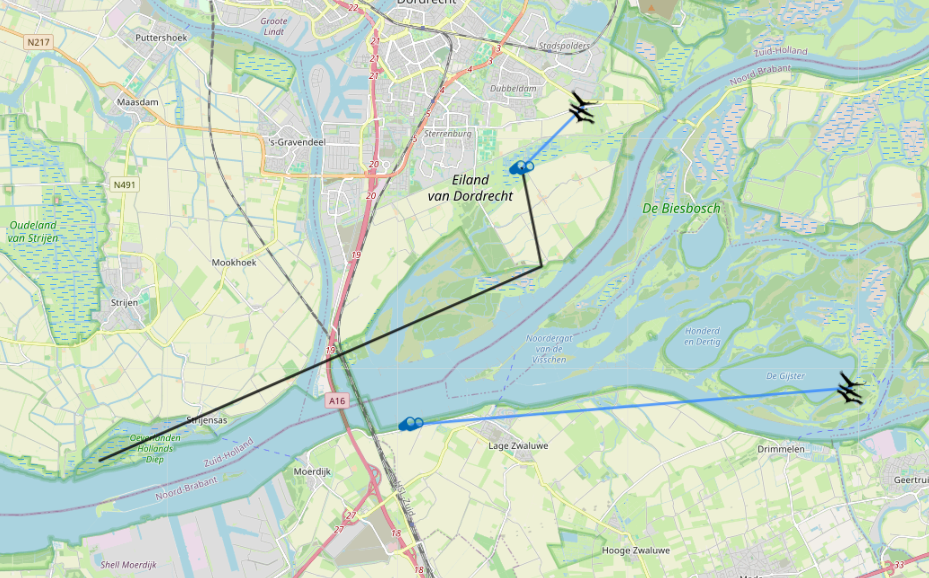
One of the main new features is a one-hour crane forecast. The Radar now allows users to look ahead and see the likelihood of spotting cranes at different locations during the coming hour. The forecast is updated every minute, giving users a better idea of when and where it may be worth going for a walk, planning a trip, or visiting an observation station. Users can choose between two probability views: the expected current situation (left) and the expected likelihood for the coming hour (right). In other words: How likely is it that cranes will be visible at a particular location during the coming hour? For both views, orange means it is time to pay attention.
A clearer and more accessible colour scheme
We also changed the colour scale used to show the likelihood of seeing cranes. Previously, the scale ran from green to red, which could be confusing because red represented a high chance of seeing cranes, rather than a warning. The new scale is more intuitive: blue (cold) = low chance, red (warm) = high chance. It also improves accessibility for people with common forms of colour blindness, making the information easier to understand at a glance.
Following the journey of the cranes
Another development is the ability to explore historical crane routes and previous sightings. Rather than only showing where cranes are flying today, the Radar will allow users to look back at where cranes have already been observed during their migration. This provides a broader view of their journey and helps users understand migration patterns over time.
Science and citizen observations working together
The historical route feature is also closely connected to the citizen science aspect of the Crane Radar. Observations submitted by people in the field contribute to the data behind the Radar and its models. The quality and quantity of these observations matter. The better the observations, the better the data becomes — and the better the models can ultimately perform. It is a two-way process: science supports the observations, and observations help strengthen the science.
More ways to explore and understand the Radar
Several additional improvements are now available, making the Crane Radar more informative and engaging:
Users can now share photos and add notes in the new Community tab, making it easier to exchange real-time observations and updates during migration. Posts remain visible for two hours, helping users stay connected and share timely insights from the field.
Improved news and notifications make it easier to share timely migration updates and expert insights directly with users — for example, when conditions indicate that it could be a particularly good day for crane watching.
Educational videos explain how the Radar works in an accessible way, including how crane movements are detected, how their speed is measured, how flight paths are predicted, and how the digital twin works. You can find them under the About the Radar tab (Over de radar), in the Science and Background (Wetenshap en achtergrond) section.
Live migration statistics showing how many cranes have already been spotted during the day are currently in development and will be ready for the next migration.
Looking ahead to October
The August hackathon was another important step in turning user feedback into practical improvements. With the next crane migration approaching in October, we are excited to see how users experience the renewed Radar — and to continue learning from their feedback. The Crane Radar is an evolving project, built through collaboration between science, technology and the people who follow these remarkable birds.
Support the Crane Radar
The Crane Radar is developed to make crane migration accessible, engaging and understandable to everyone. If you would like to support its further development, you can help us by making a donation.