
HEATMAPS IN FOCUS 360 & THE ANALYTICAL TOOLBOX
From Real-Time Situational Awareness to Report-Ready Analysis
Understanding where activity is concentrated is essential for effective conservation management. Whether you're monitoring wildlife movements, analysing patrol coverage, or identifying observation hotspots, heatmaps transform large volumes of location data into intuitive visualisations, helping you spot patterns that might otherwise remain hidden.
With the latest July updates, Sensing Clues now offers heatmaps in both Focus 360 and the Analytical Toolbox — each designed for a different purpose.
Focus 360: Heatmaps for Real-Time Situational Awareness
Focus 360 now allows users to visualise both observations and tracks as interactive heatmaps. Observation heatmaps highlight areas with a high density of records, while track heatmaps reveal frequently visited locations, making them particularly valuable for analysing animal GPS data or patrol movements.
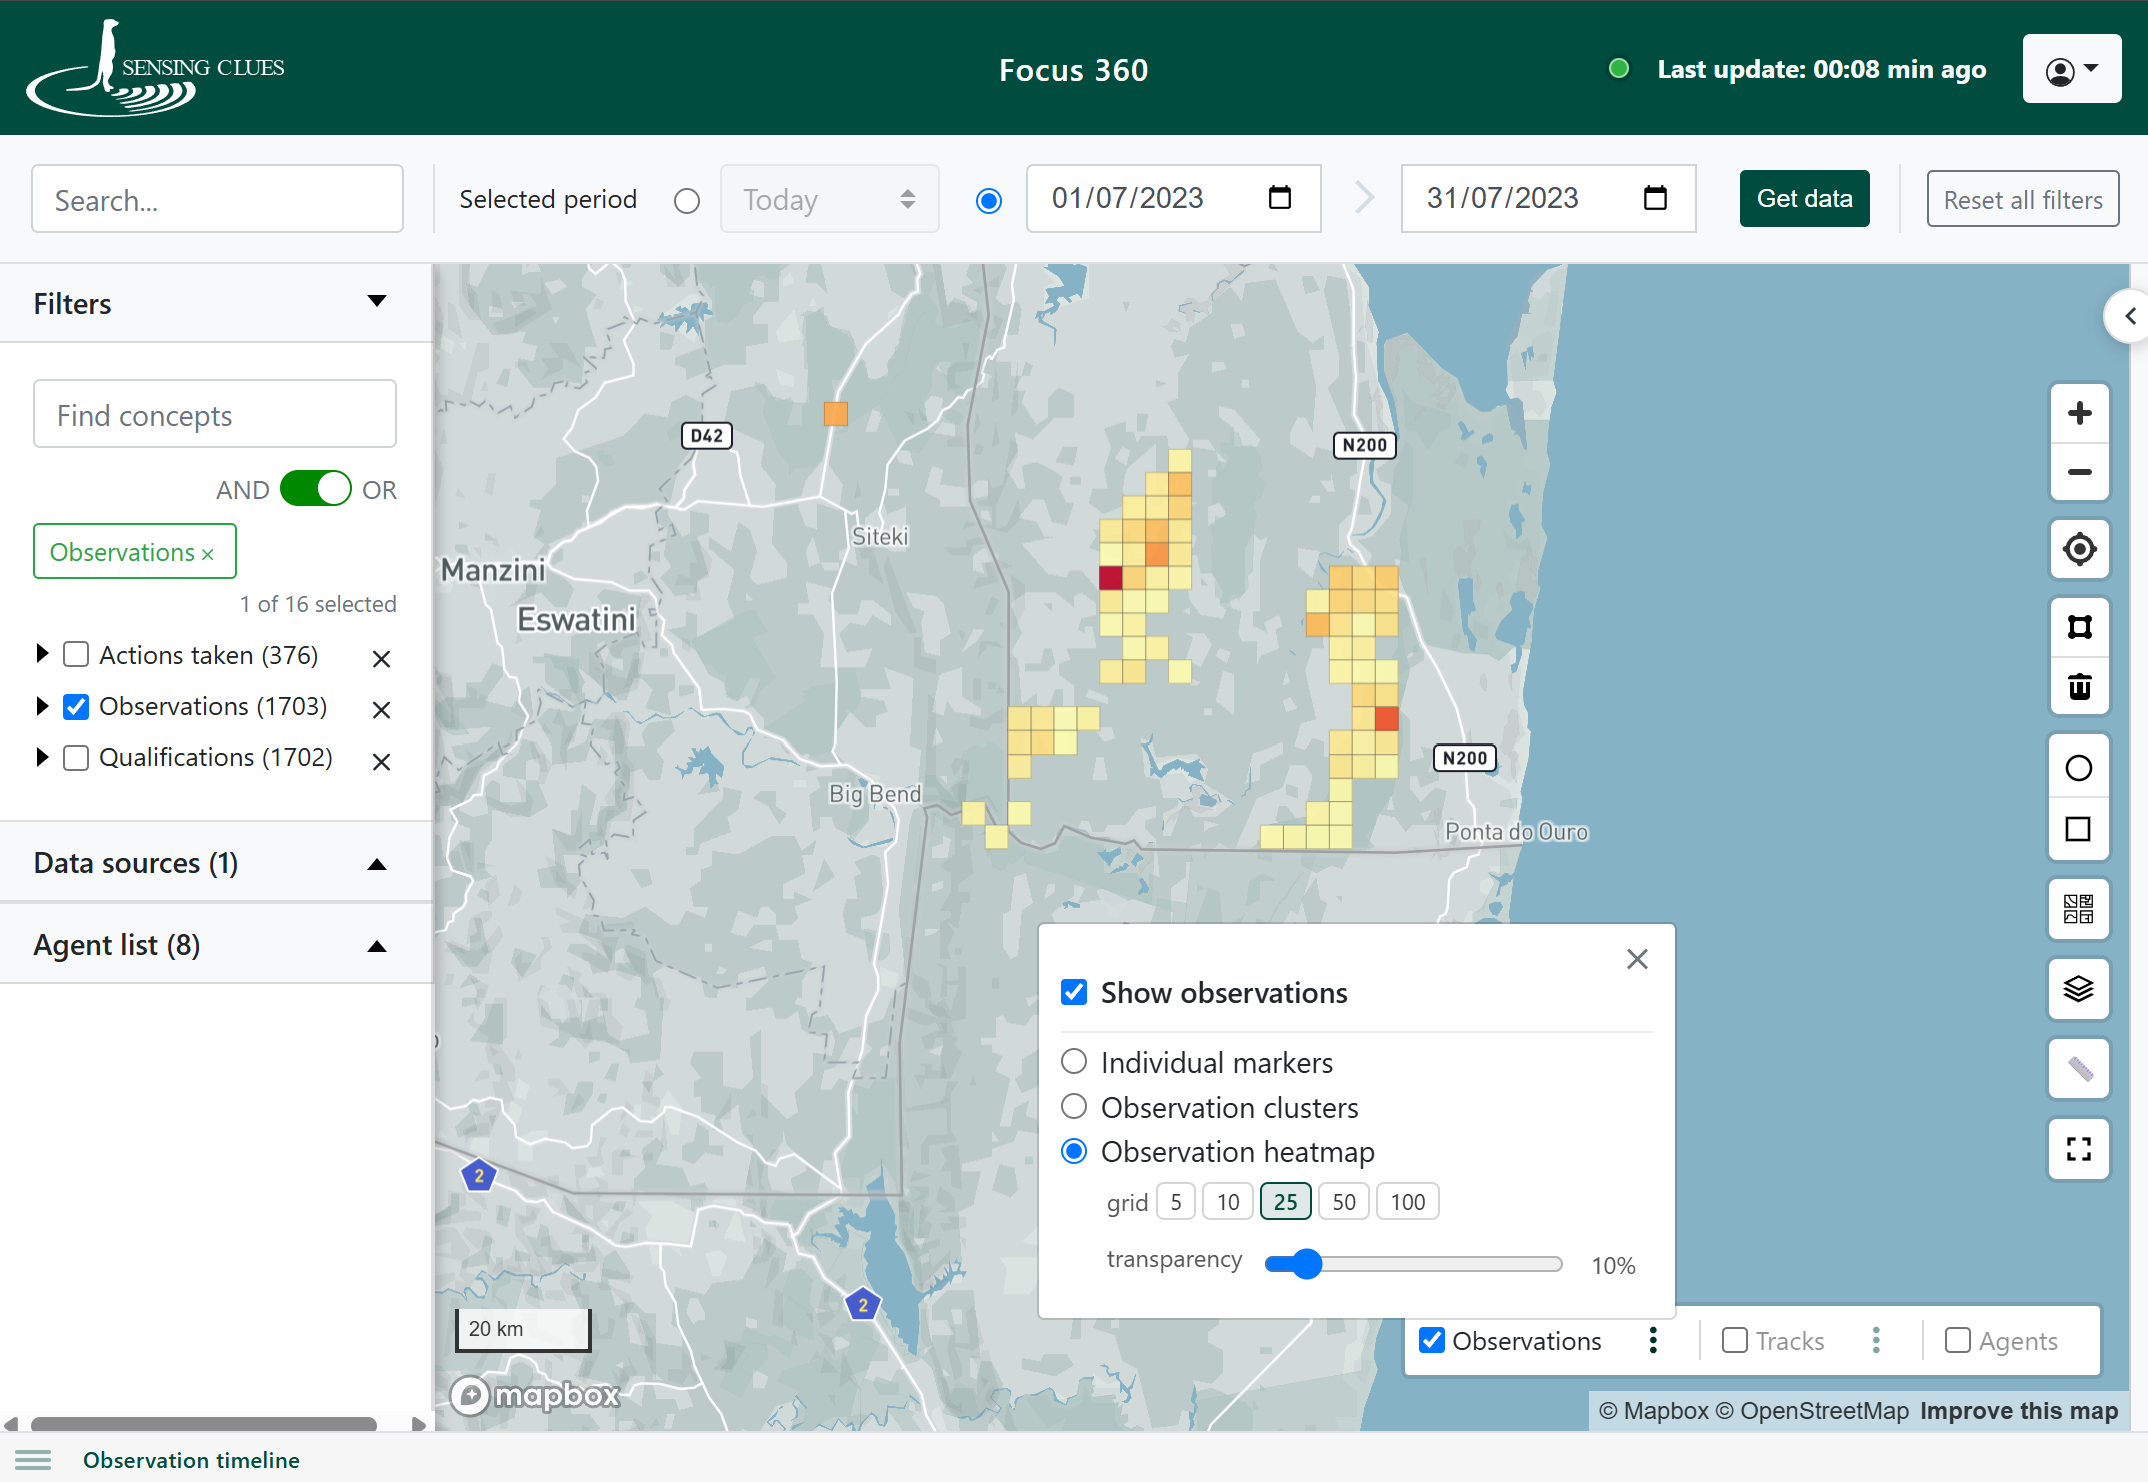
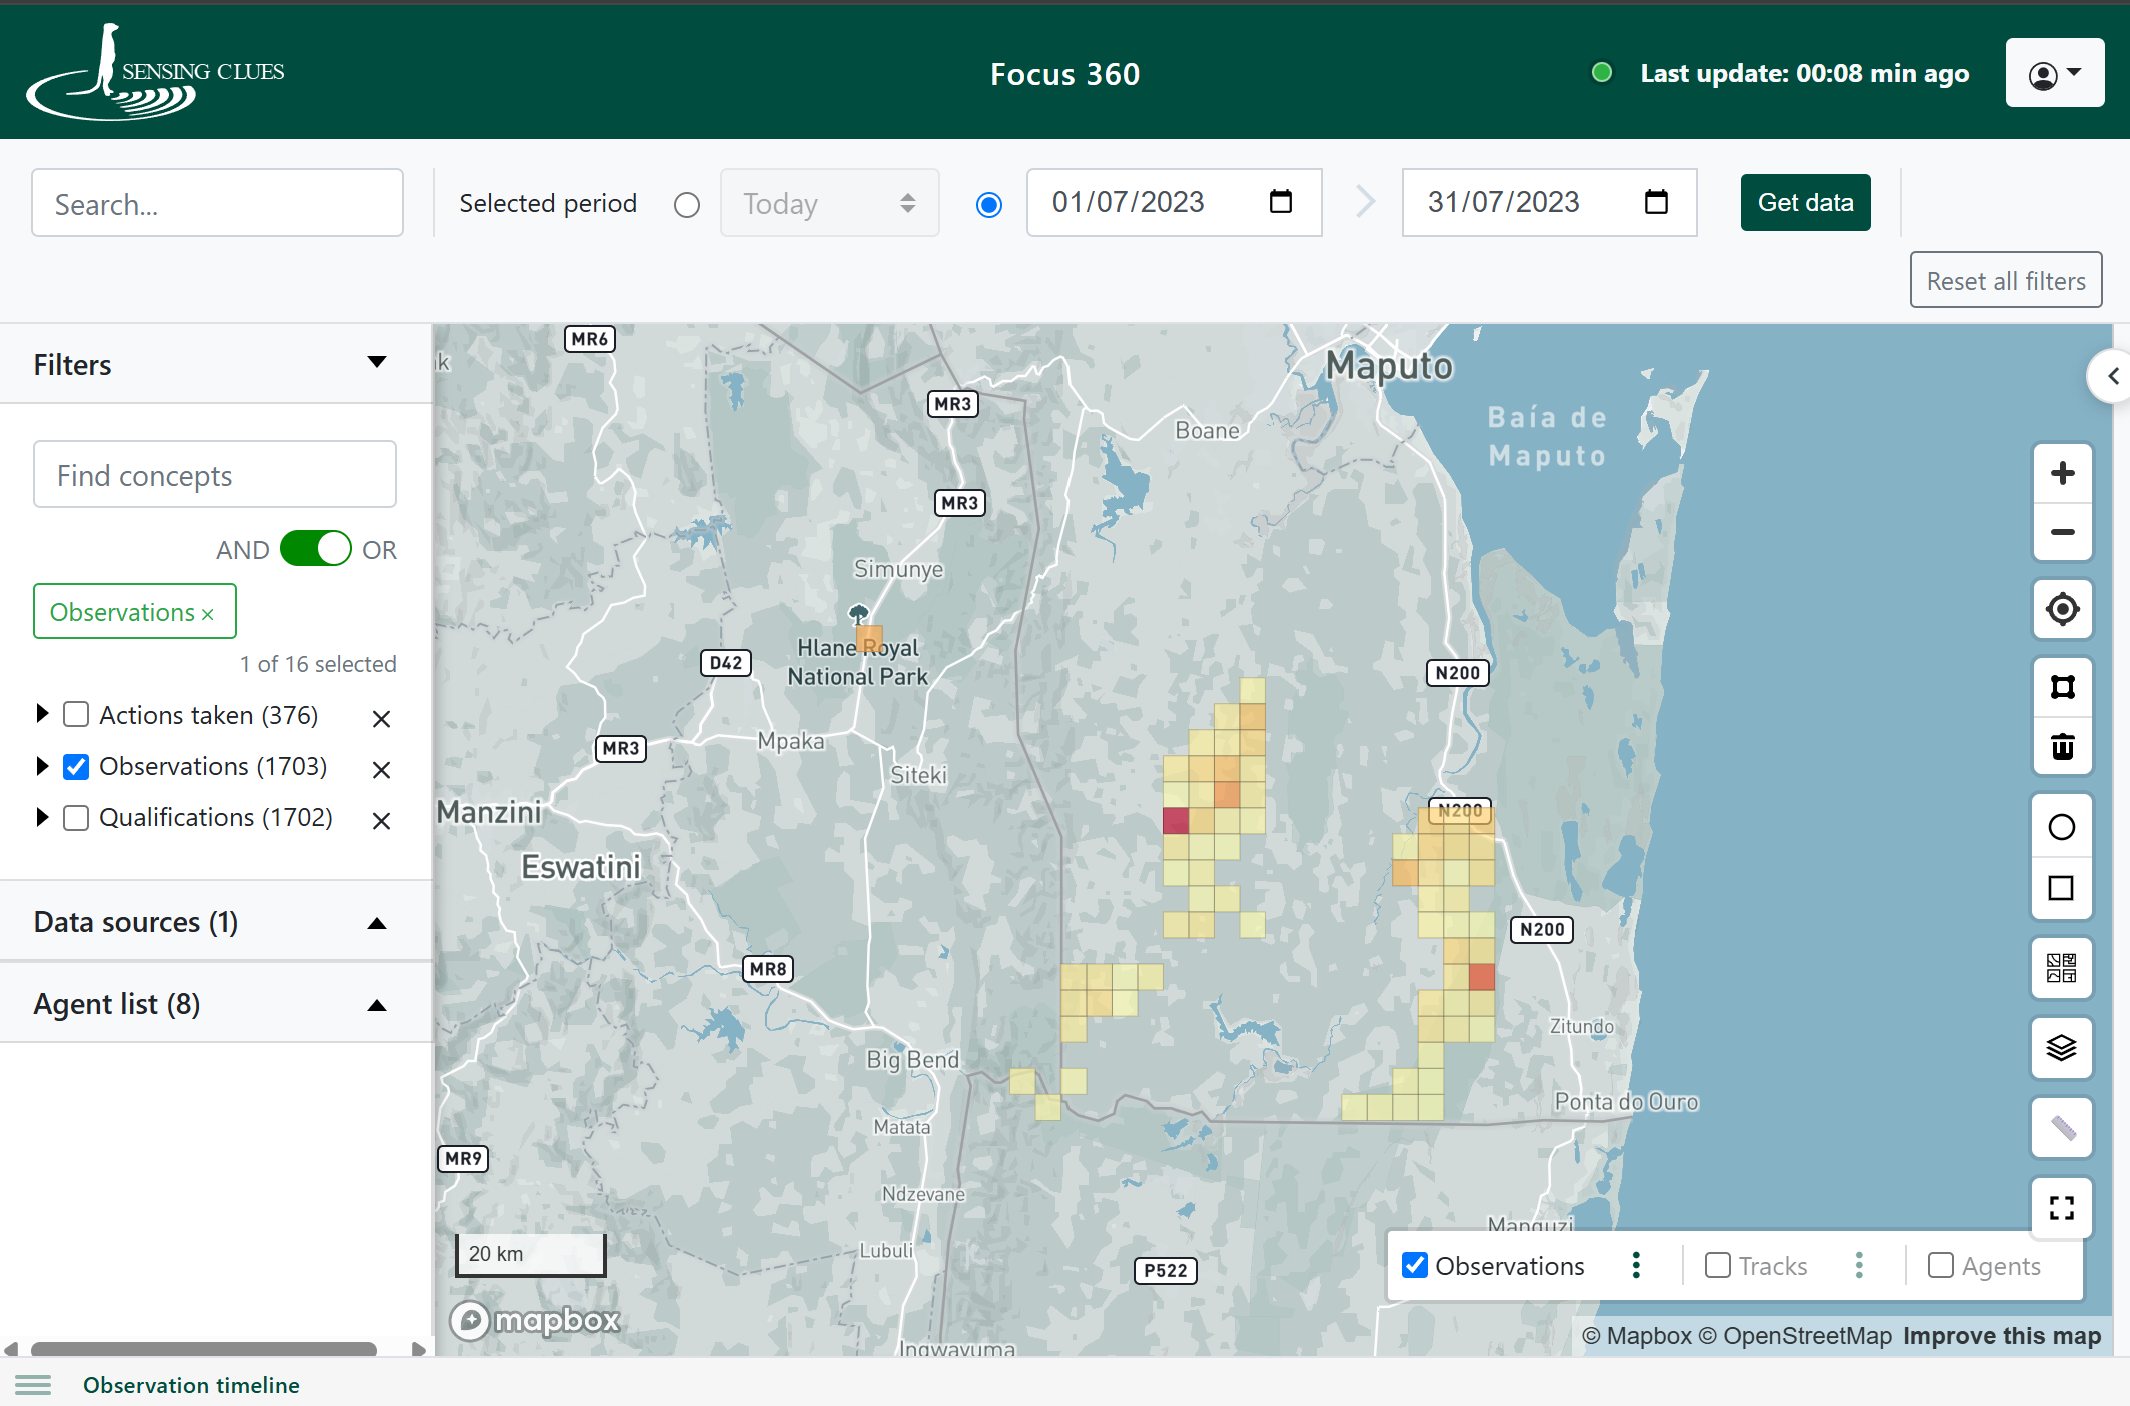
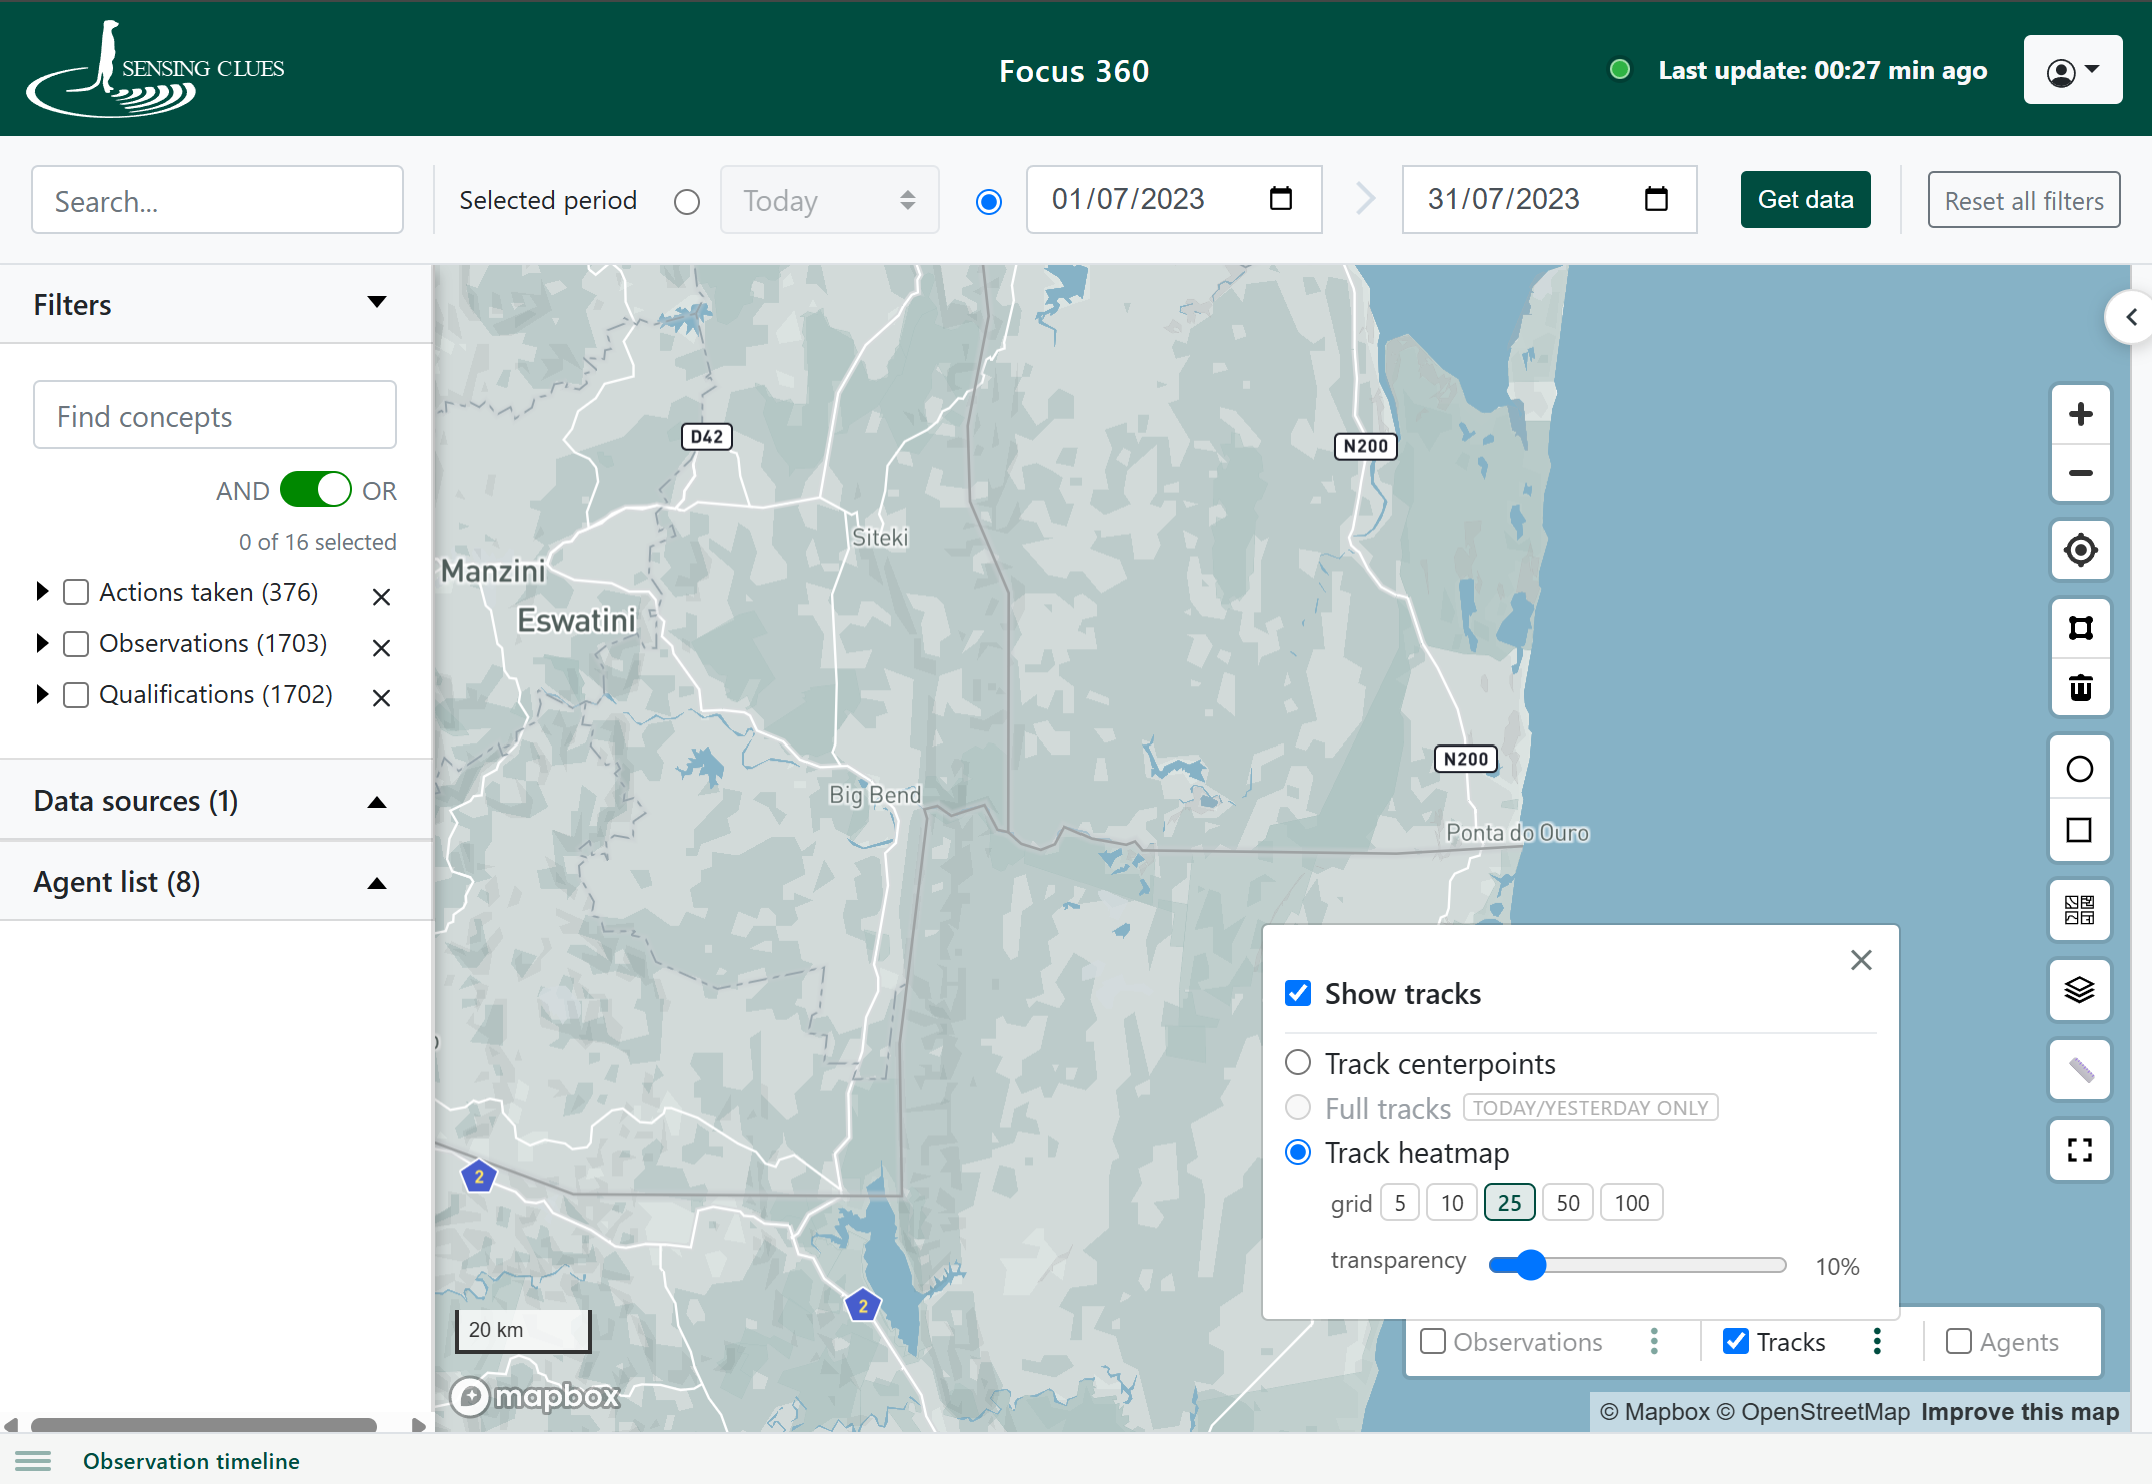
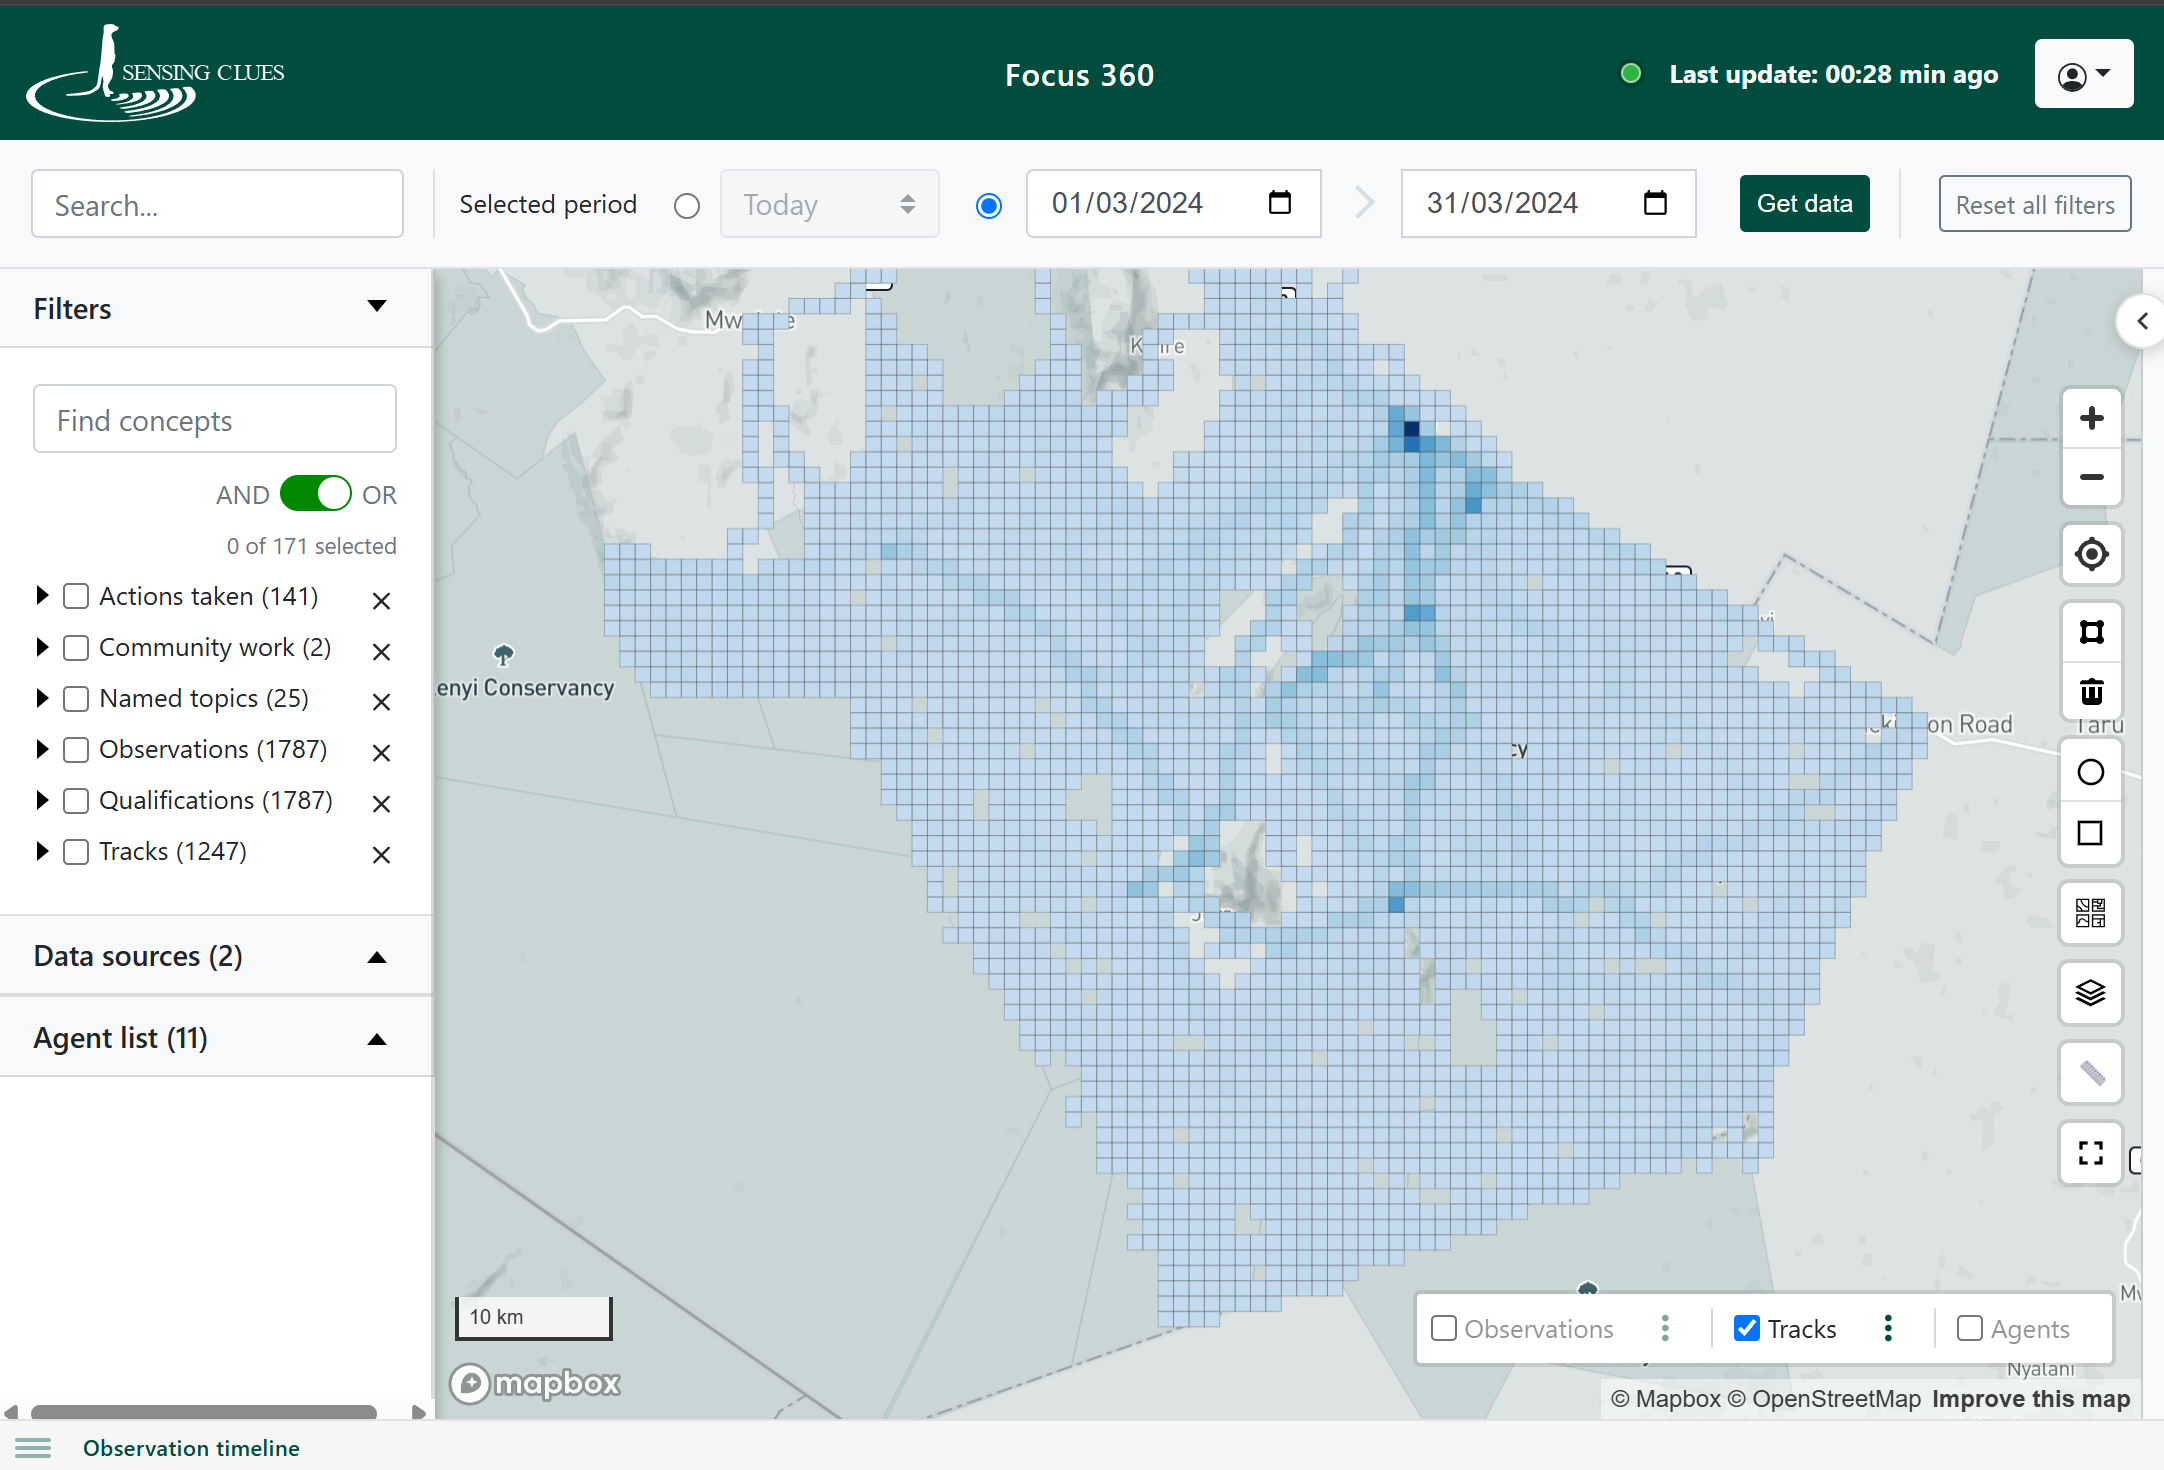
Combined with new high-detail track visualisation and time-of-day colouring and filtering, Focus 360 provides a fast, responsive environment for exploring movement patterns as they happen and supporting operational decision-making in the field.
Analytical Toolbox: Heatmaps for Advanced Analysis & Reporting
The Analytical Toolbox takes heatmap analysis a step further with powerful features designed for detailed analysis and professional reporting. New enhancements in the Observation Map and the Patrol Map include:
Consistent heatmaps that remain stable across different zoom levels.
Adjustable heatmap resolution to balance spatial detail and coverage.
Logarithmic visualisation for datasets with highly uneven distributions.
Significantly faster heatmap generation, even for large datasets.
GeoTIFF export for further analysis in GIS software such as ArcGIS and QGIS.
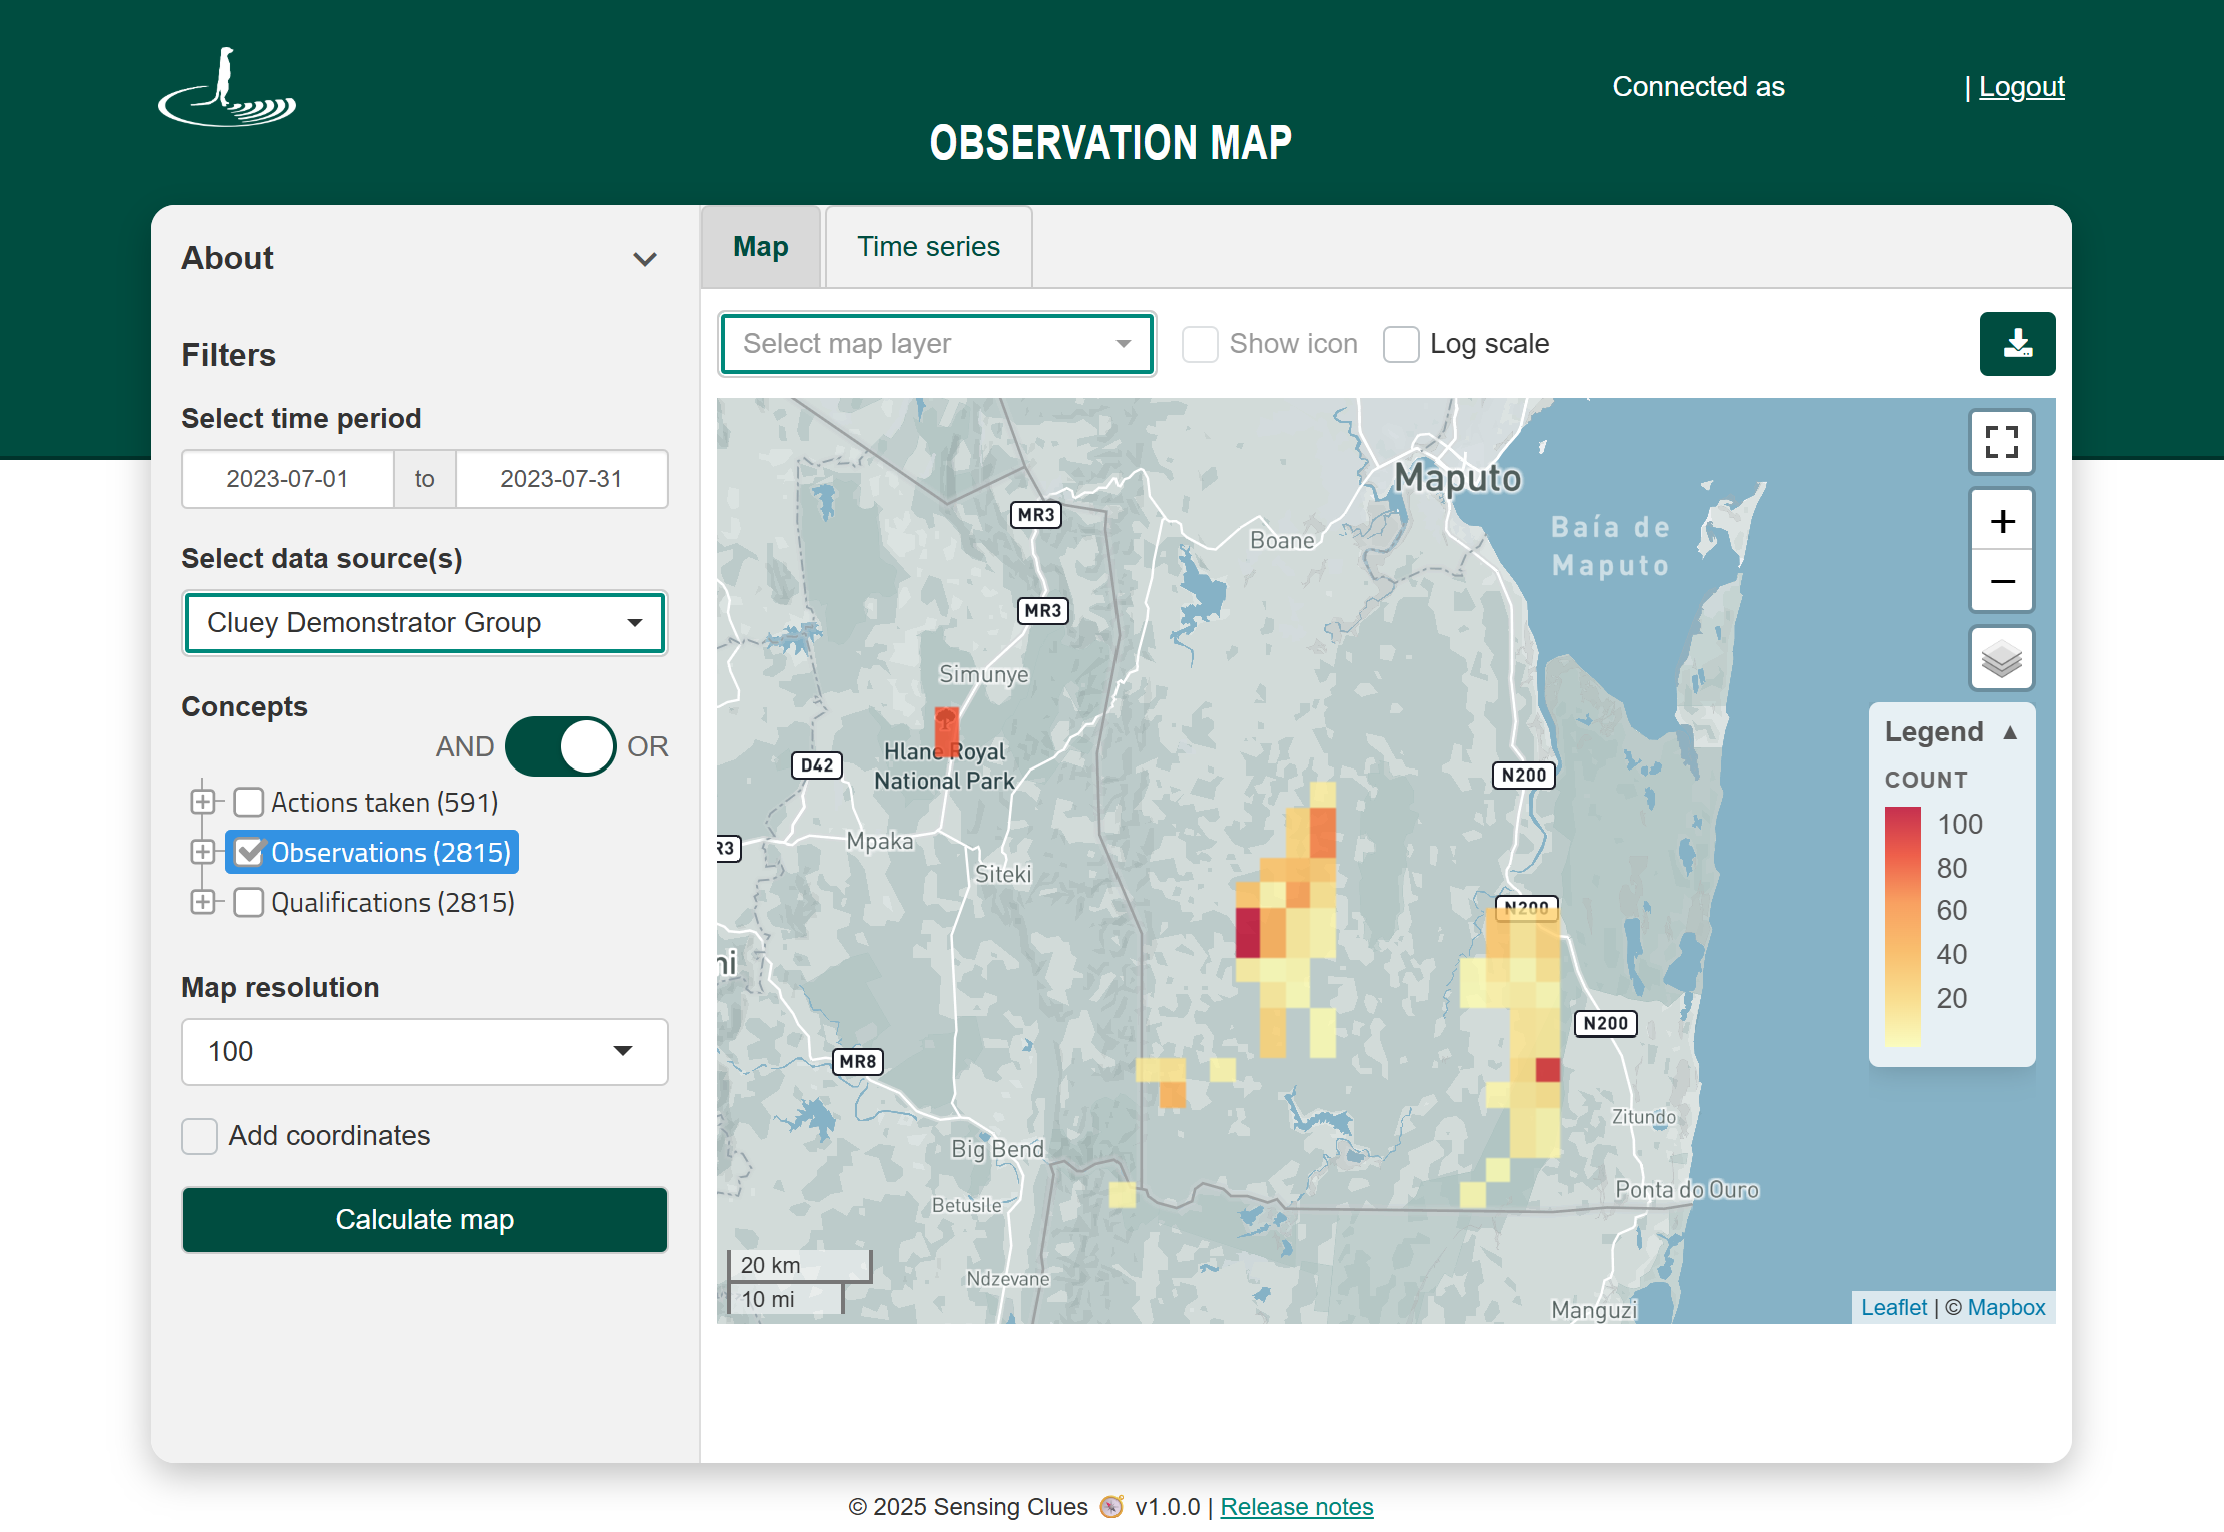
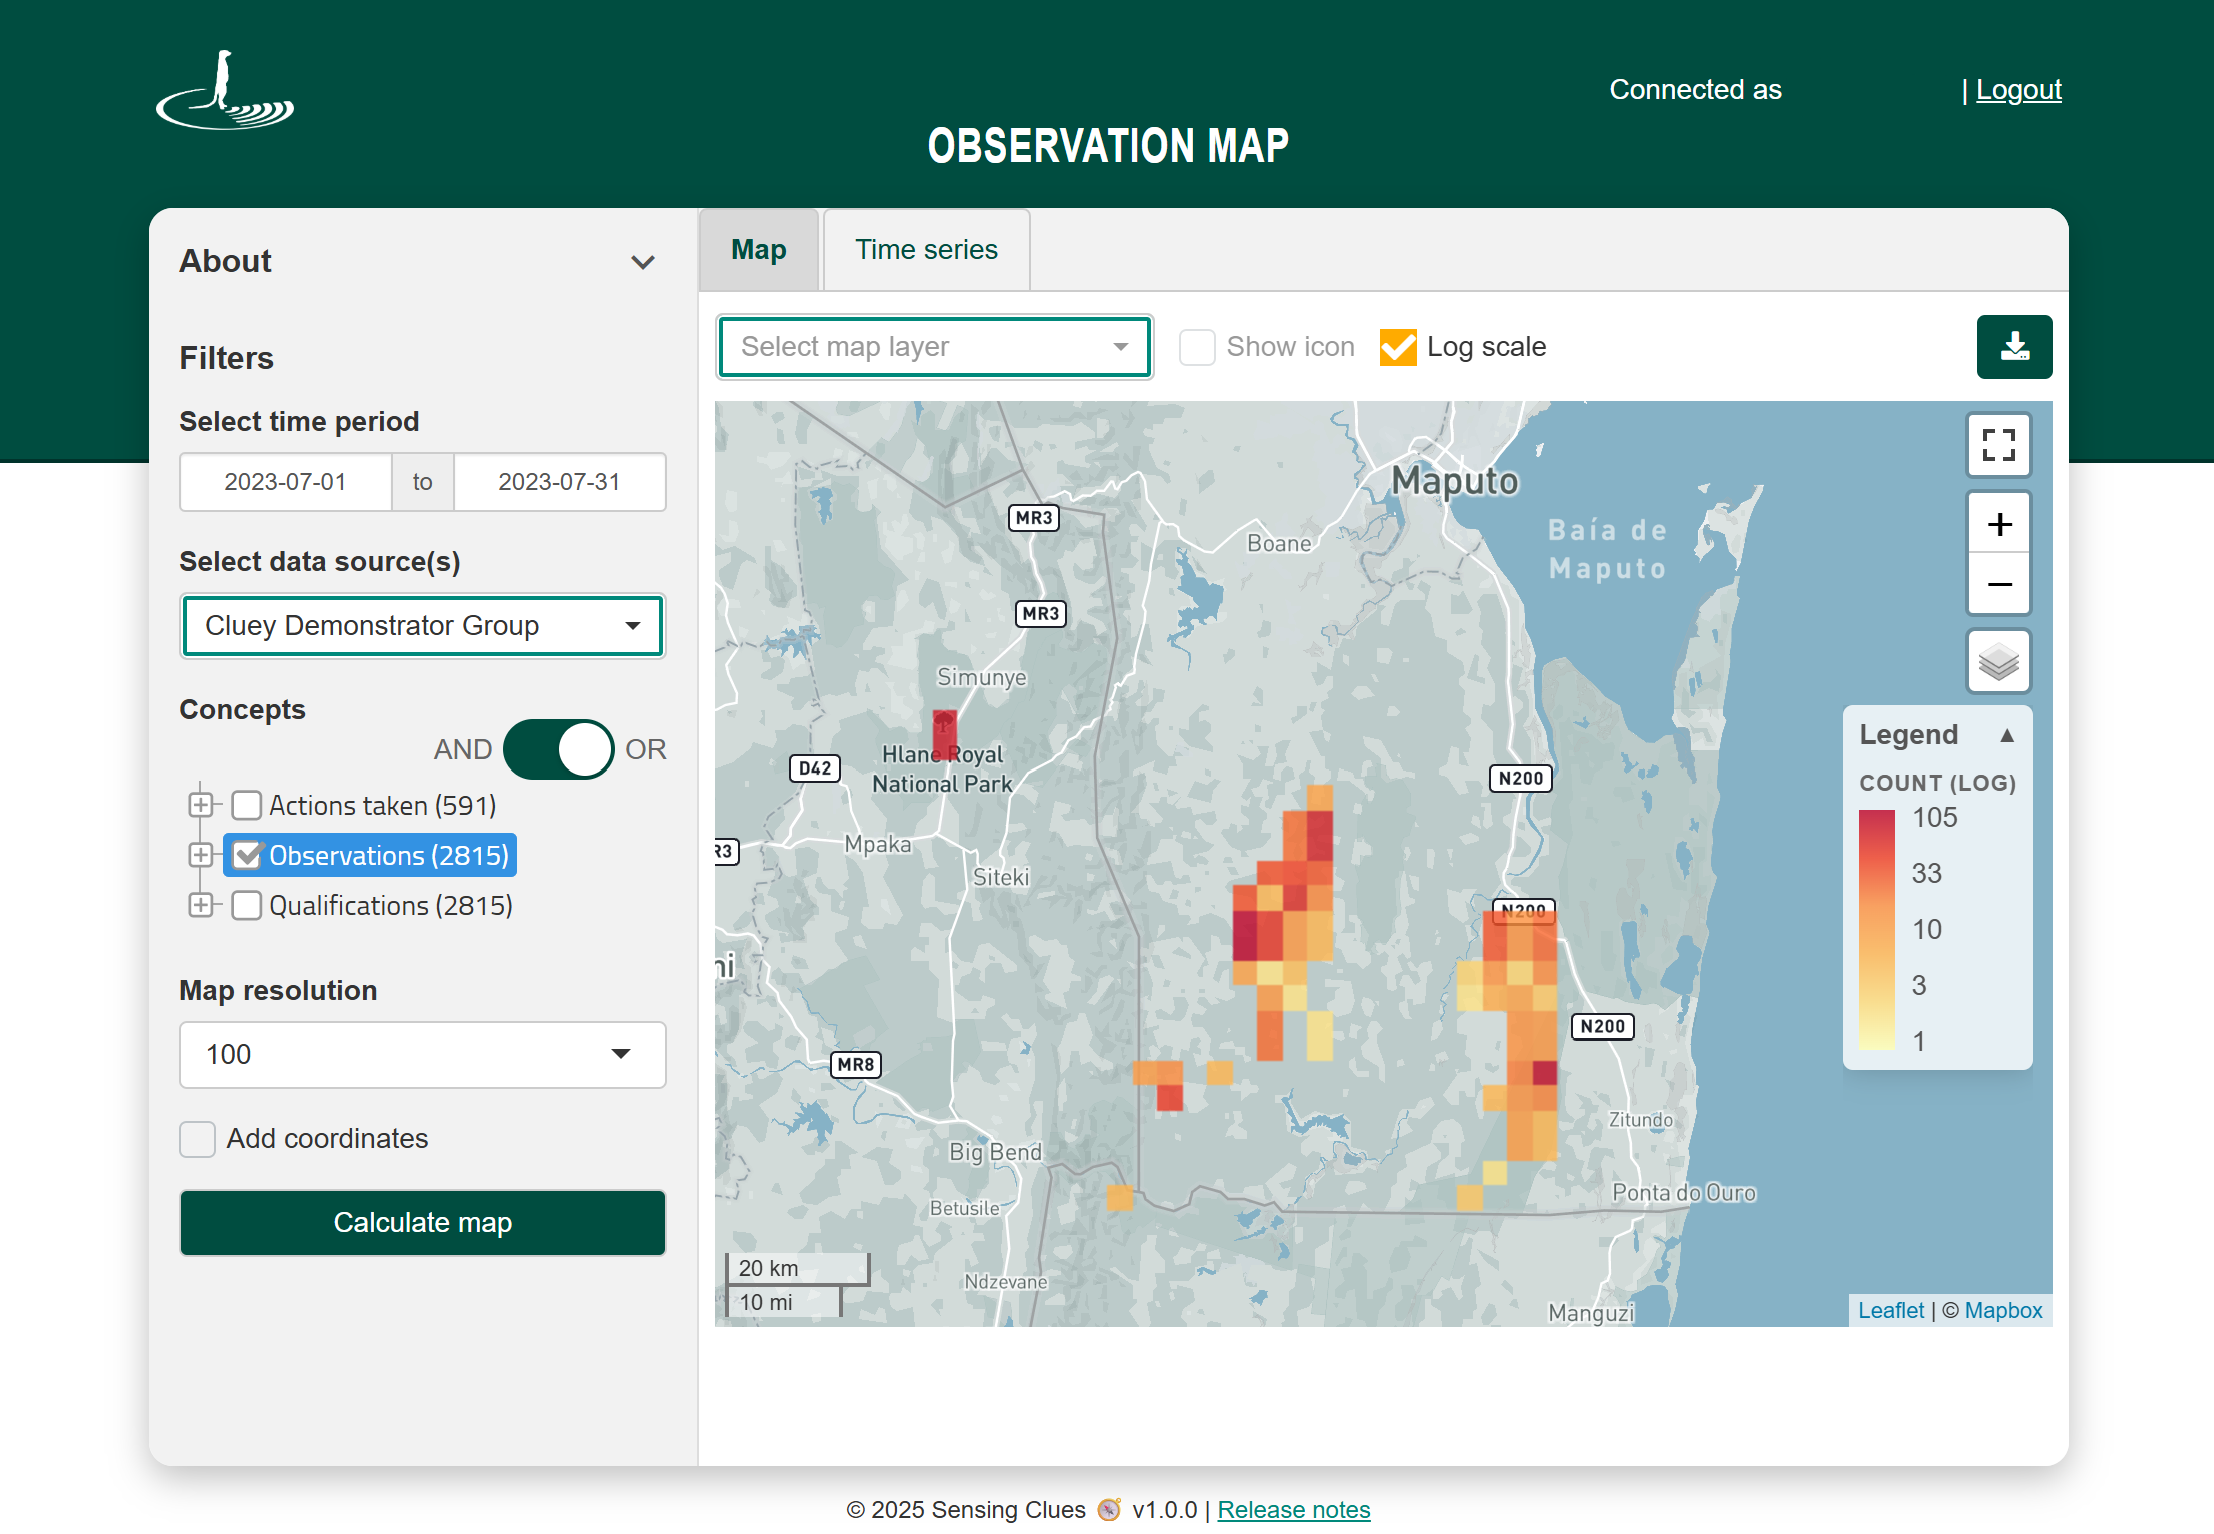
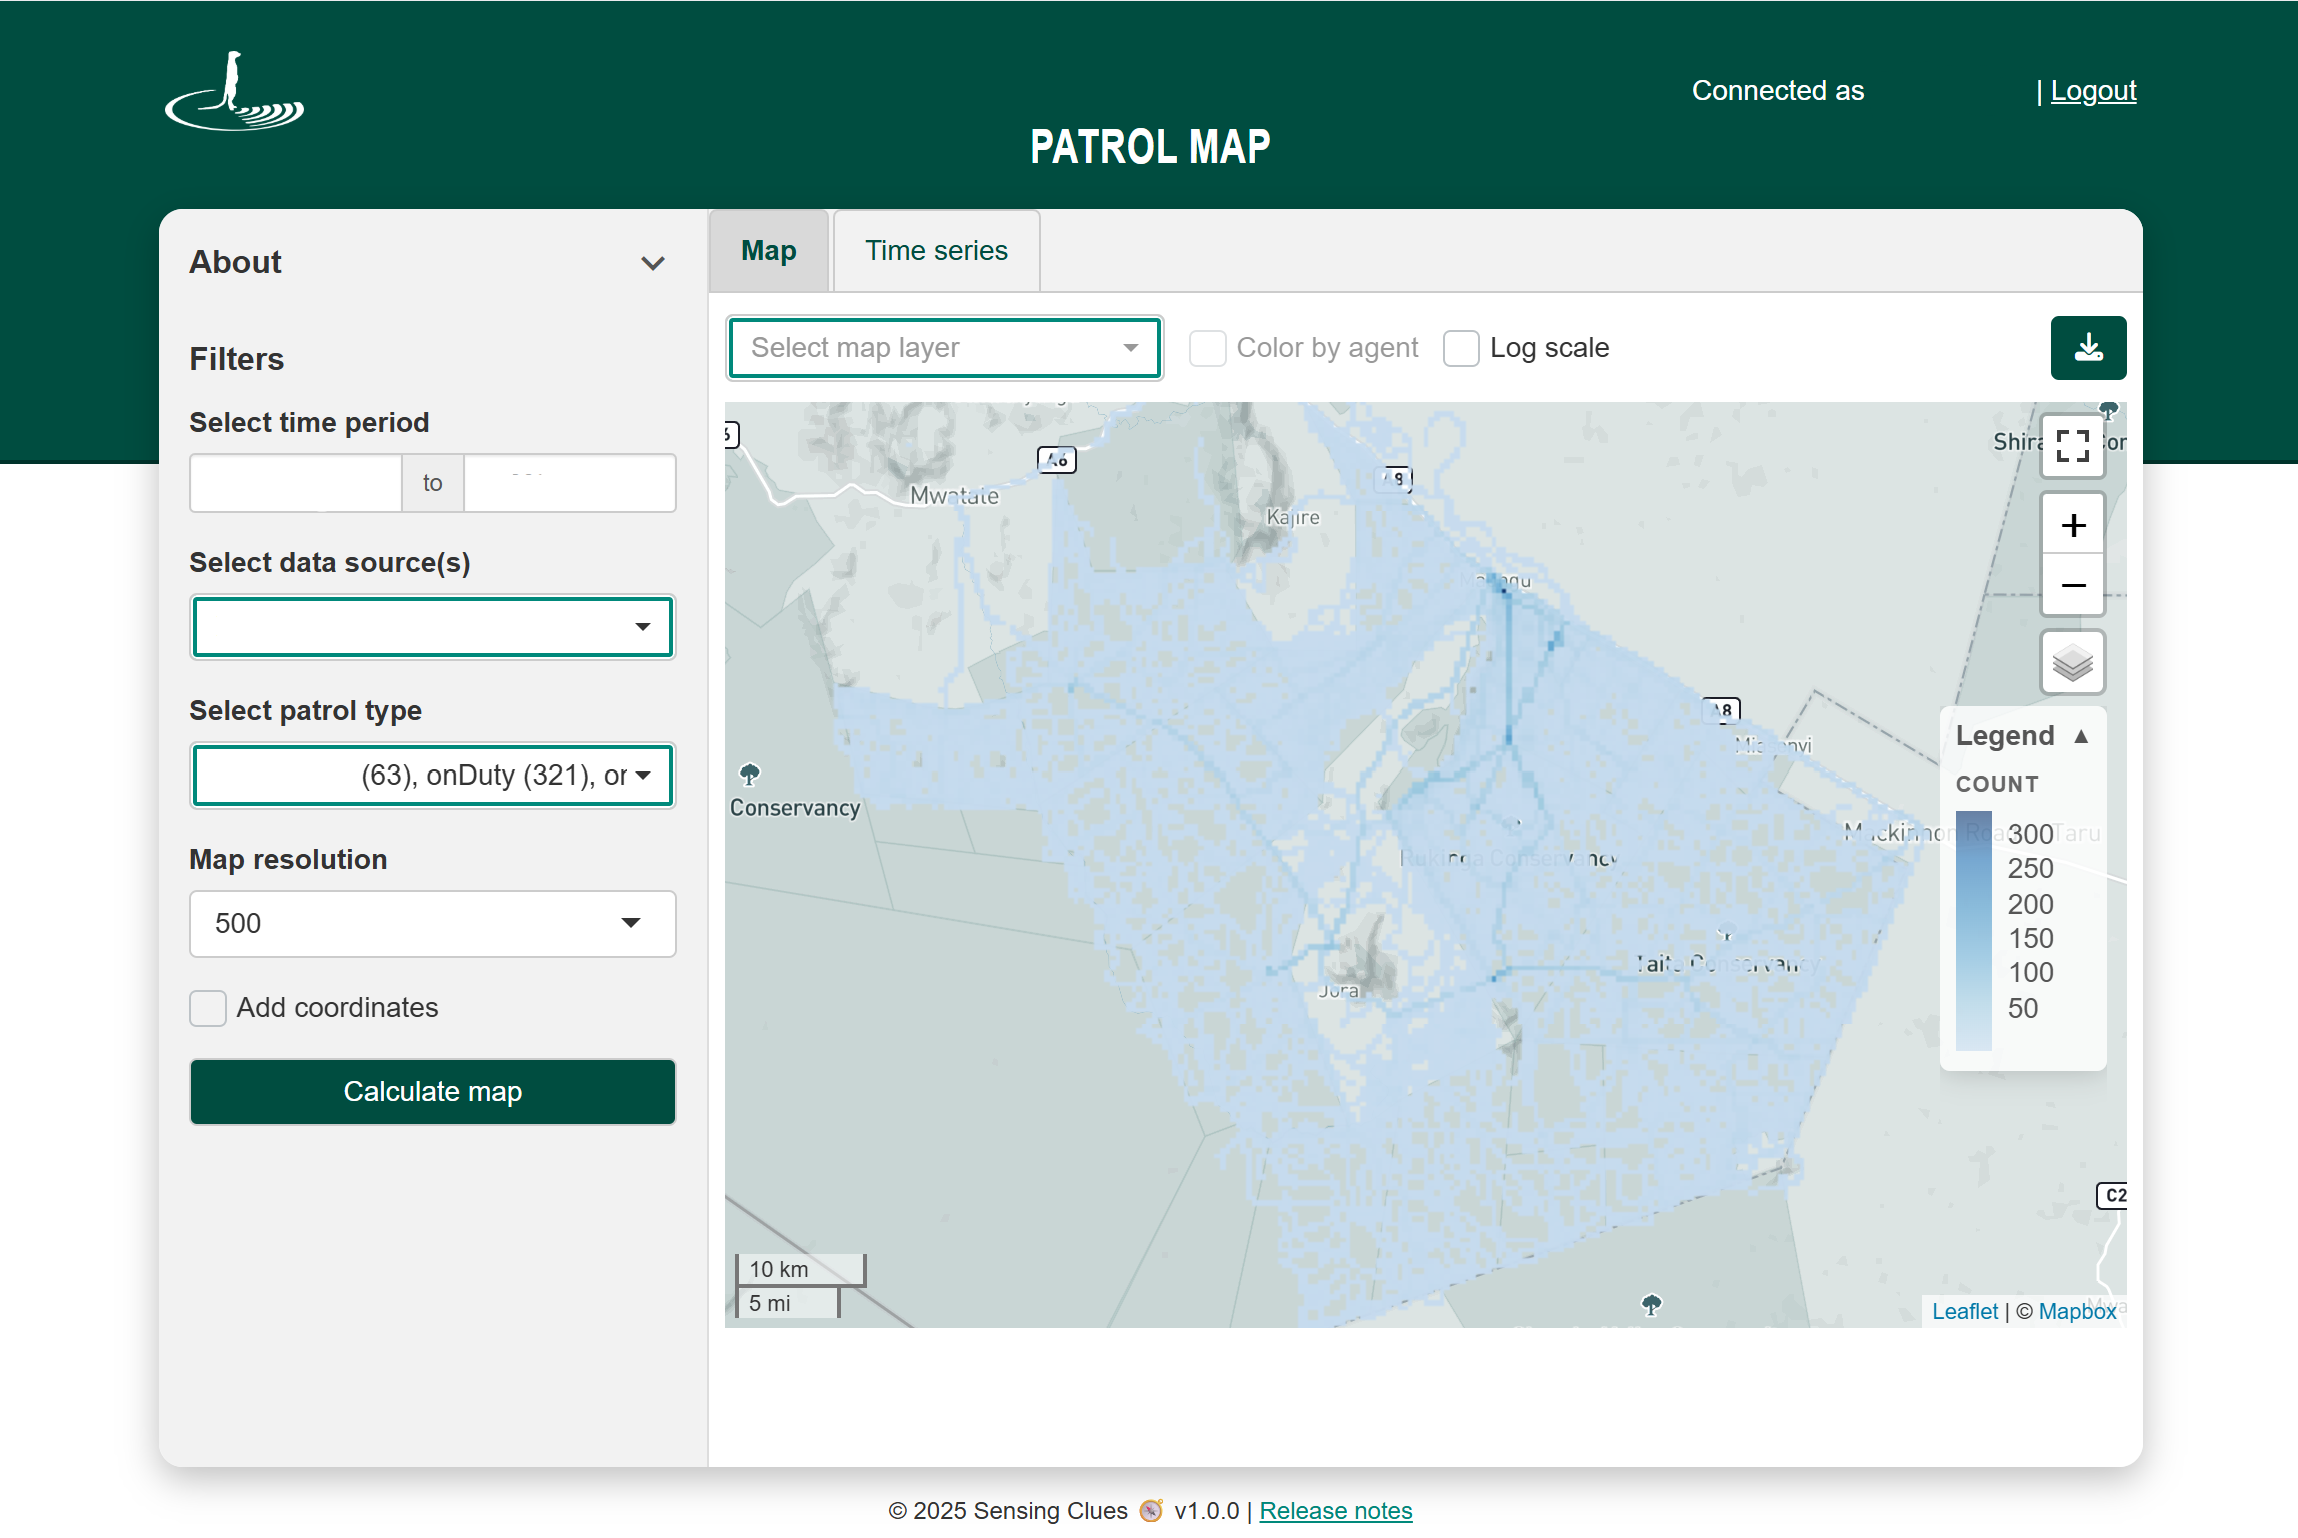
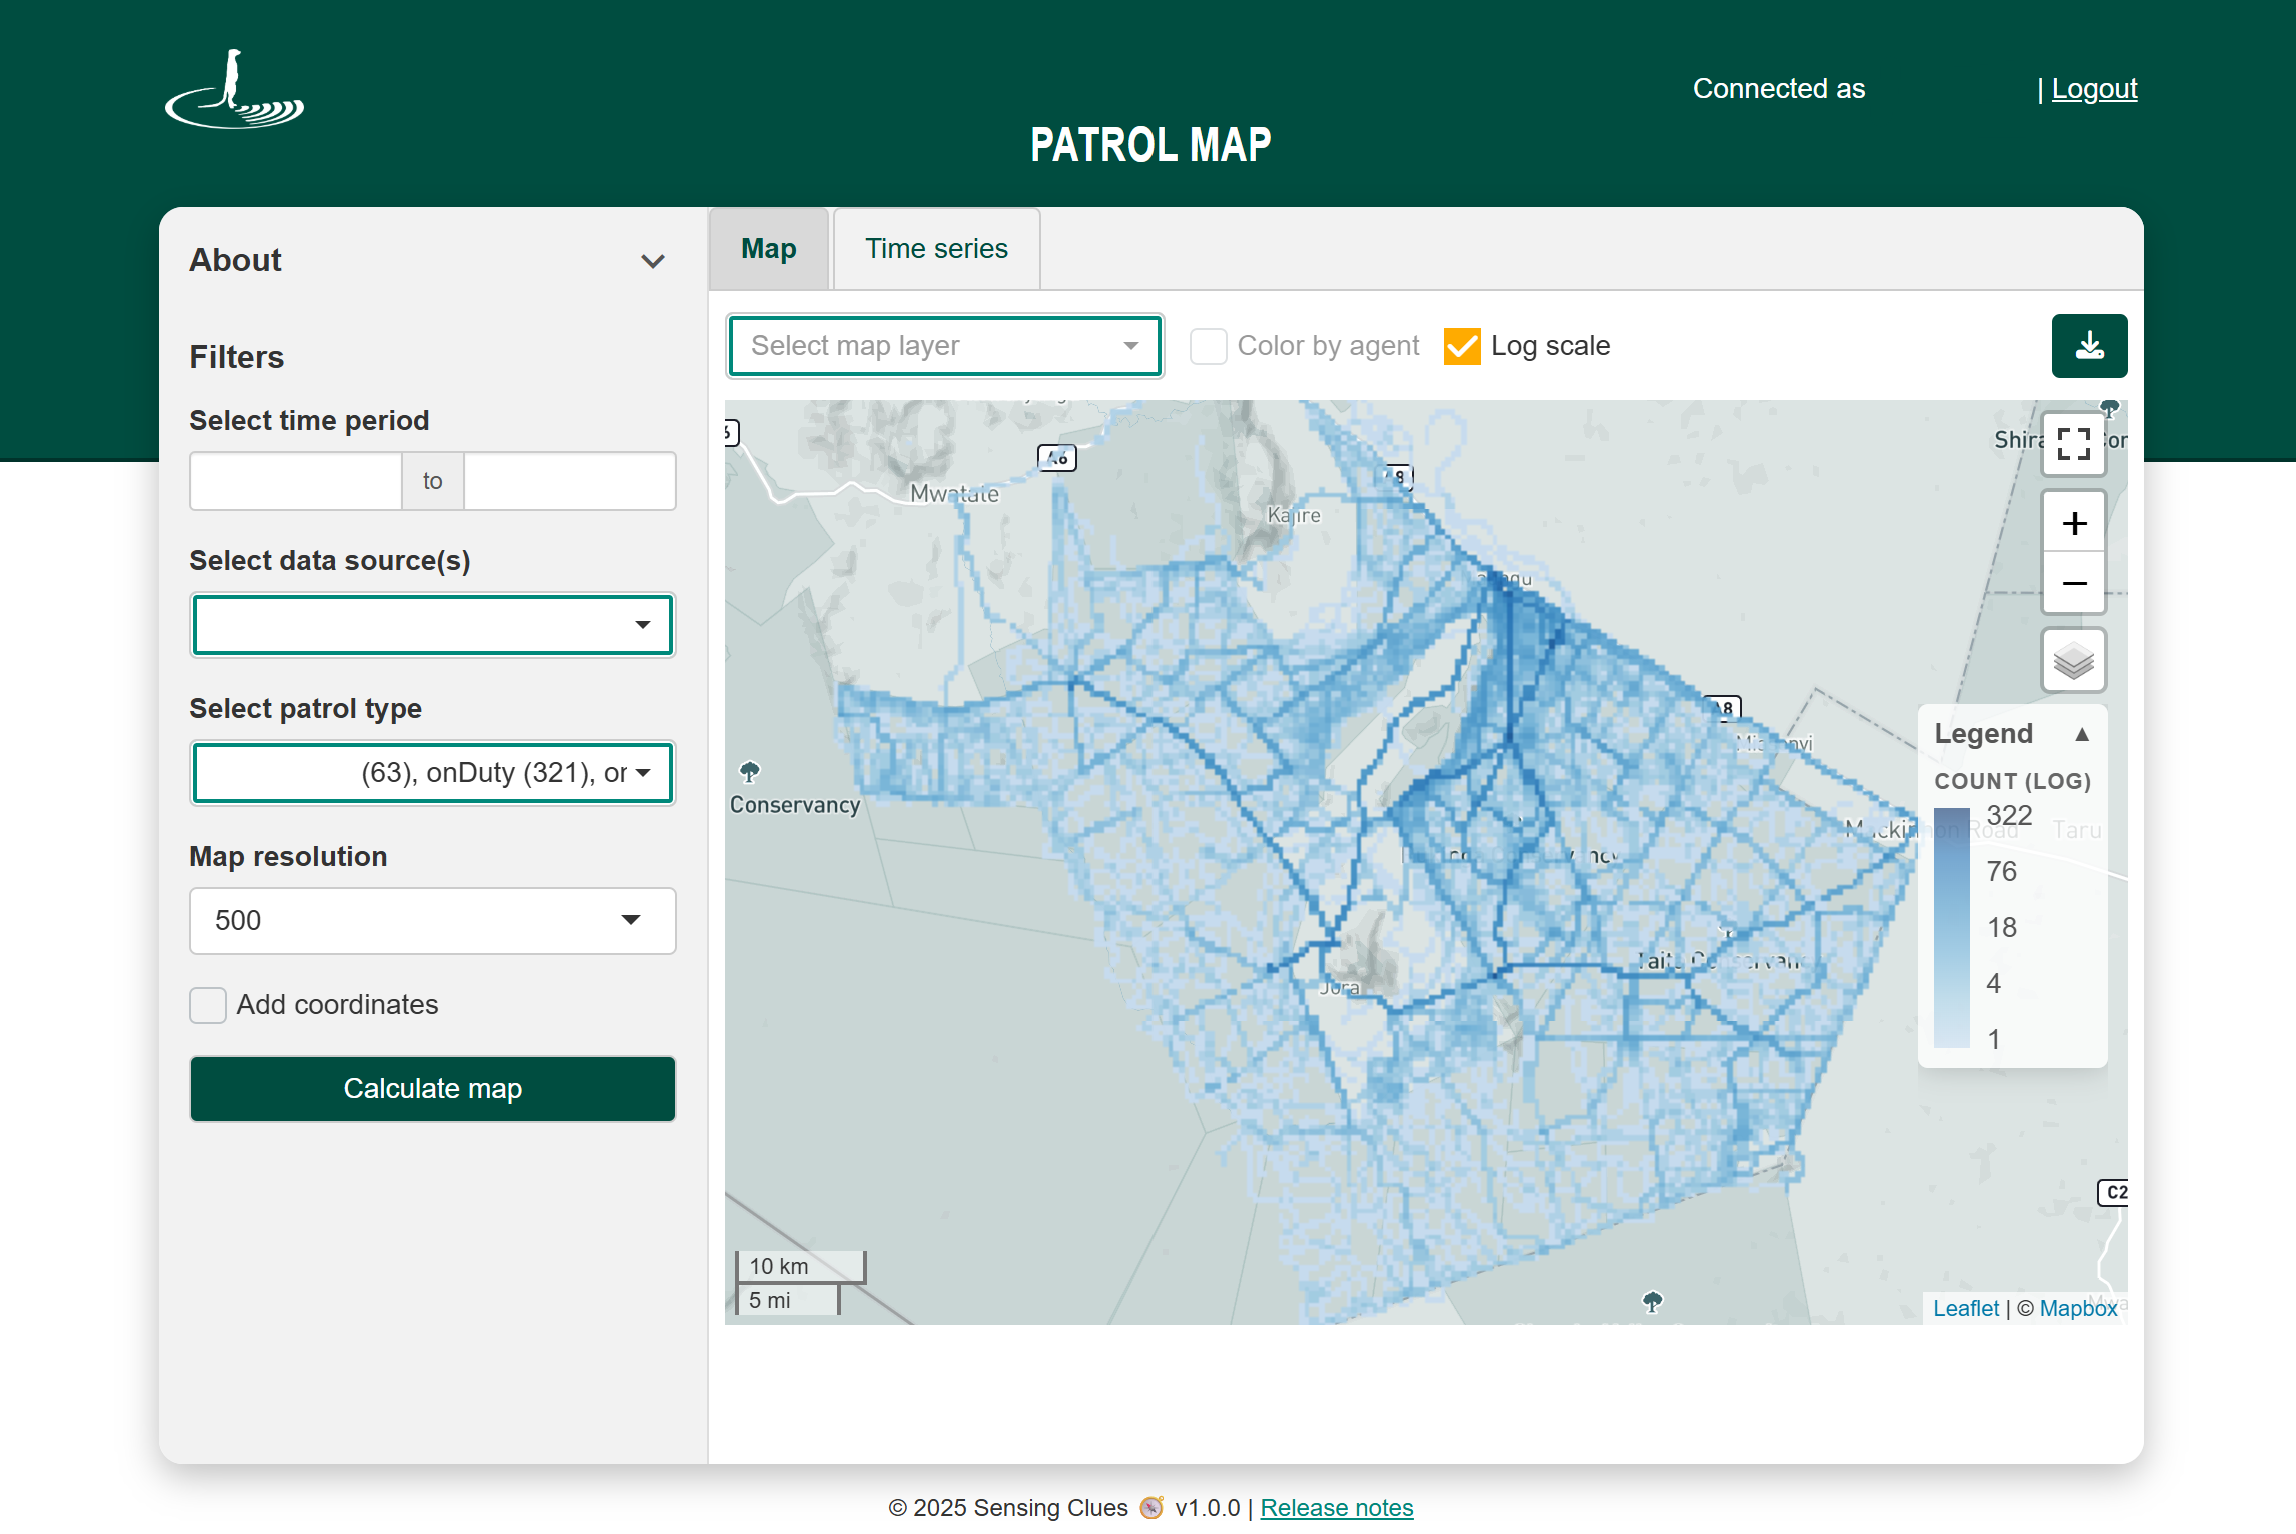
These capabilities make it easy to compare spatial patterns over time, create report-ready visualisations complete with legends, and integrate results into wider GIS and reporting workflows.
Which One Should You Use?
While both applications use heatmaps to reveal spatial patterns, they serve different purposes:
Use Focus 360 when you need fast, responsive, real-time situational awareness to monitor ongoing observations, patrols, or animal movements.
Use the Observation Map or Patrol Map when you want to perform in-depth spatial analysis, compare datasets over time, create report-ready visualisations, or export GIS-compatible outputs for further analysis and stakeholder reporting.
Together, Focus 360 and the Analytical Toolbox provide a complete workflow — from rapid operational insights in the field to advanced spatial analysis and professional reporting.
Acknowledgement
The screenshots shown in this article use data provided with the kind permission of Wildlife Works. Sensing Clues only publishes project data with the explicit consent of the respective data owners.