
ENHANCING ENVIRONMENTAL TIME SERIES ANALYSIS THROUGH THE CORRELAID CHALLENGE 2026
Insights from Project Manager Isaline Laurent
Over the past four months, a dedicated team of volunteers from CorrelAid Nederland has worked closely with Sensing Clues to enhance our Environmental Time Series Analysis tools. The goal of the challenge was to make environmental data easier to understand, interpret, and communicate. By improving visualisations, adding contextual information, and incorporating feedback from conservation practitioners, the team helped make complex satellite-derived insights more accessible to users in the field.
The result is a more intuitive and informative user experience. As Sensing Clues founder Jan-Kees Schakel puts it: "The improvements are very intuitive and provide valuable context that really helps users understand what they are looking at."
We would like to extend our sincere thanks to this year's challenge team: Felicity, Isaline, Marie, Mario, Rutger, and Sreekala from CorrelAid, as well as Mitchell and Melanie from Sensing Clues. Together, they achieved more than 95% of the original project goals and delivered valuable improvements that are already benefiting conservation practitioners in the field.
In the interview below, Isaline Laurent, Project Manager of the CorrelAid Challenge 2026, reflects on the team's achievements, lessons learned, and the impact of involving conservation partners throughout the development process.

1. Isaline, looking back on the past four months, what are you most proud of the team having achieved? What made the collaboration successful, and were there any particular challenges along the way?
I am most proud of the fact that we were able to deliver meaningful improvements to the application in such a short period of time. Four months may sound like a long time, but it first required the team to understand the existing platform, become familiar with the codebase, and fully grasp the needs and expectations behind the project. The collaboration worked so well because everyone brought different skills and perspectives to the table while sharing a common goal. A key factor in our success was the continuous support from Melanie, Mitchell, and the wider Sensing Clues team, who were always available to guide us and answer questions. One of the biggest challenges was that we were working remotely across different locations, and all team members were contributing alongside their regular jobs and other commitments. Finding times when everyone could meet was not always easy, so we often worked in smaller groups or divided tasks into individual work packages. Despite these challenges, the team remained highly engaged and collaborative throughout the project.
2. Can you share some of the most important improvements delivered during the challenge?
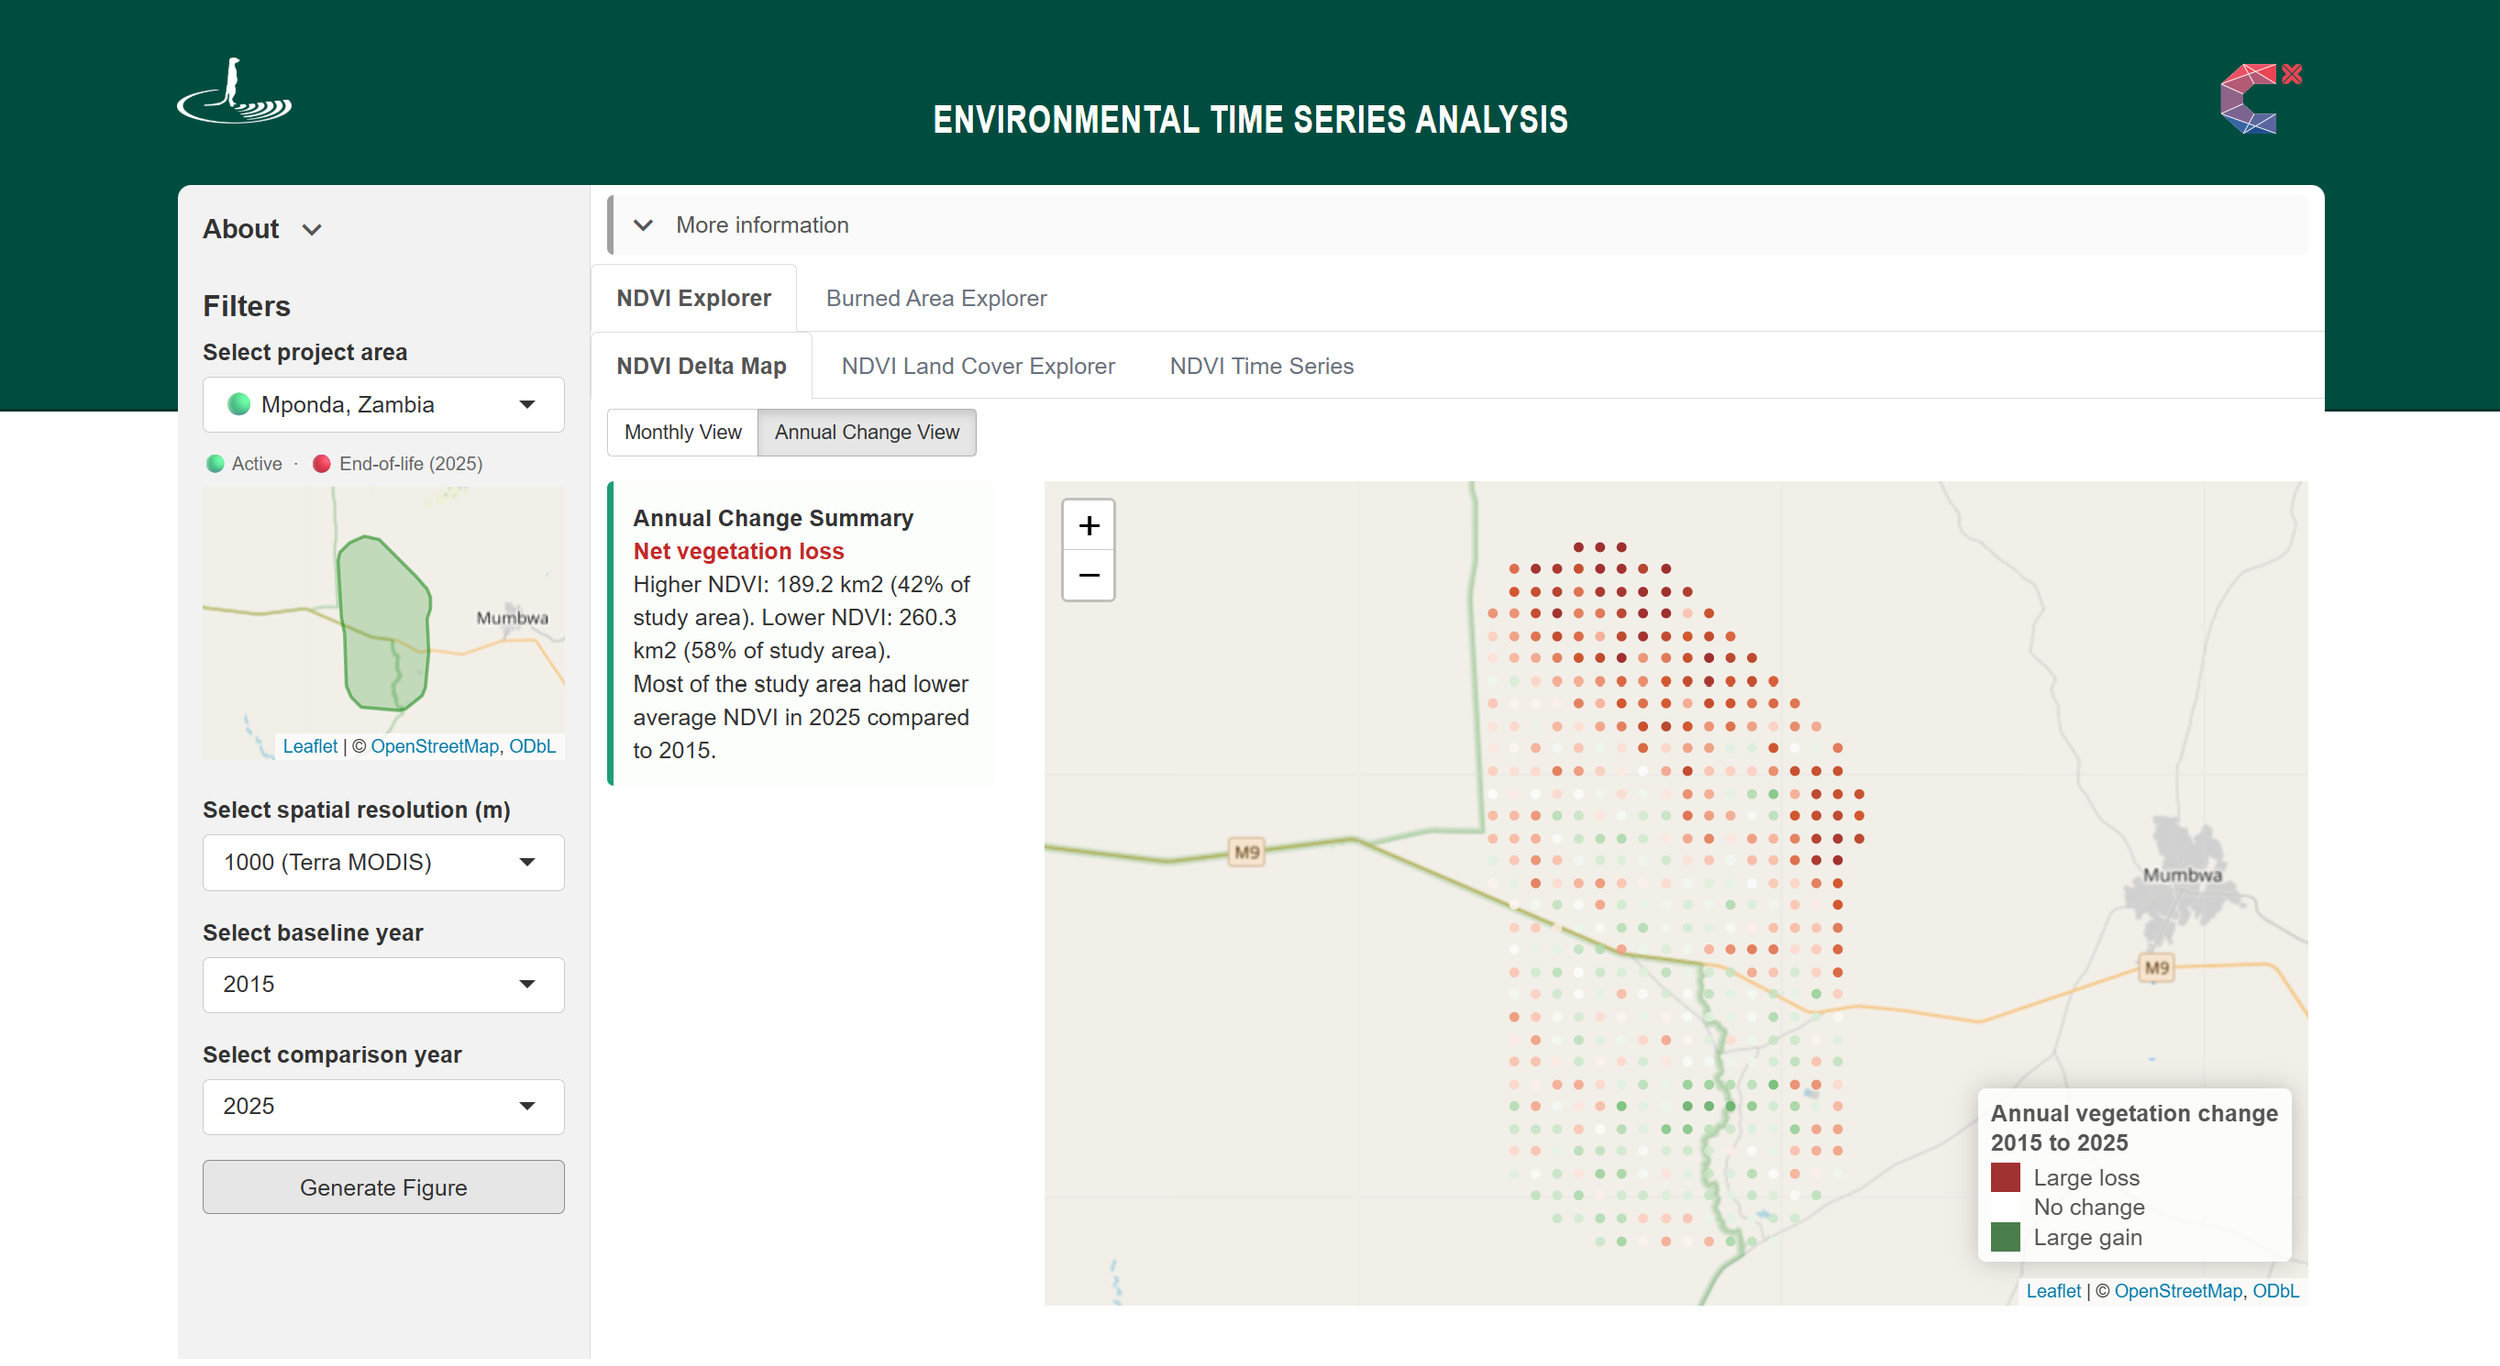
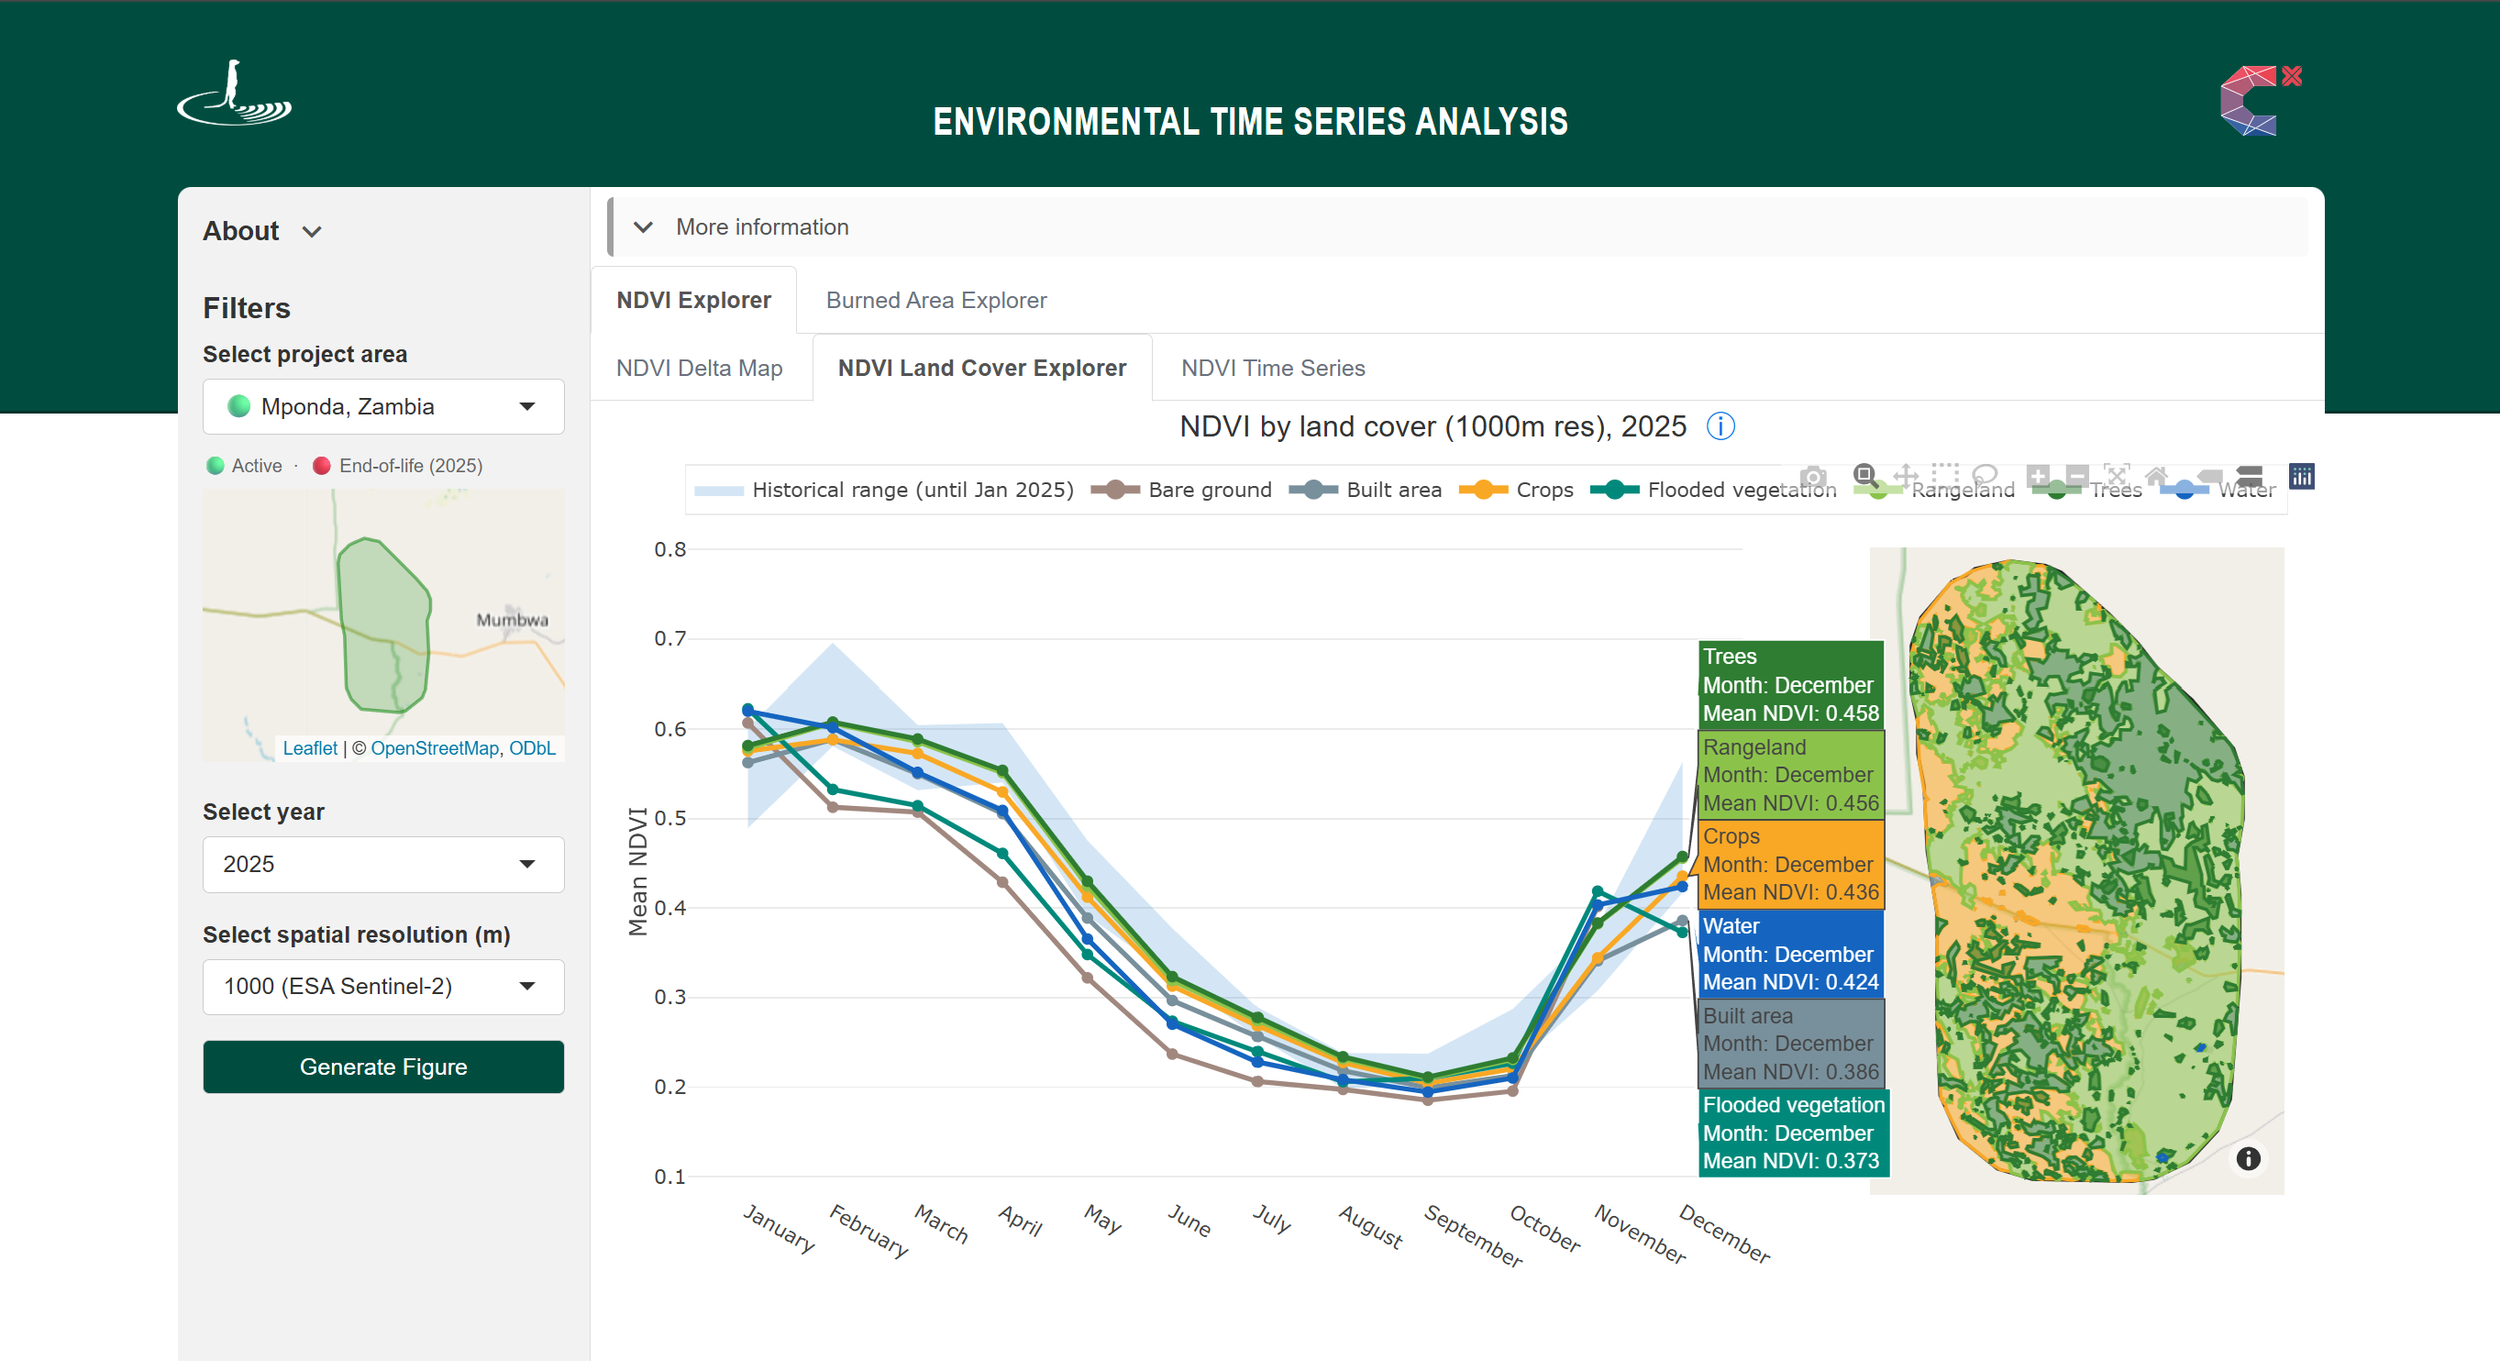
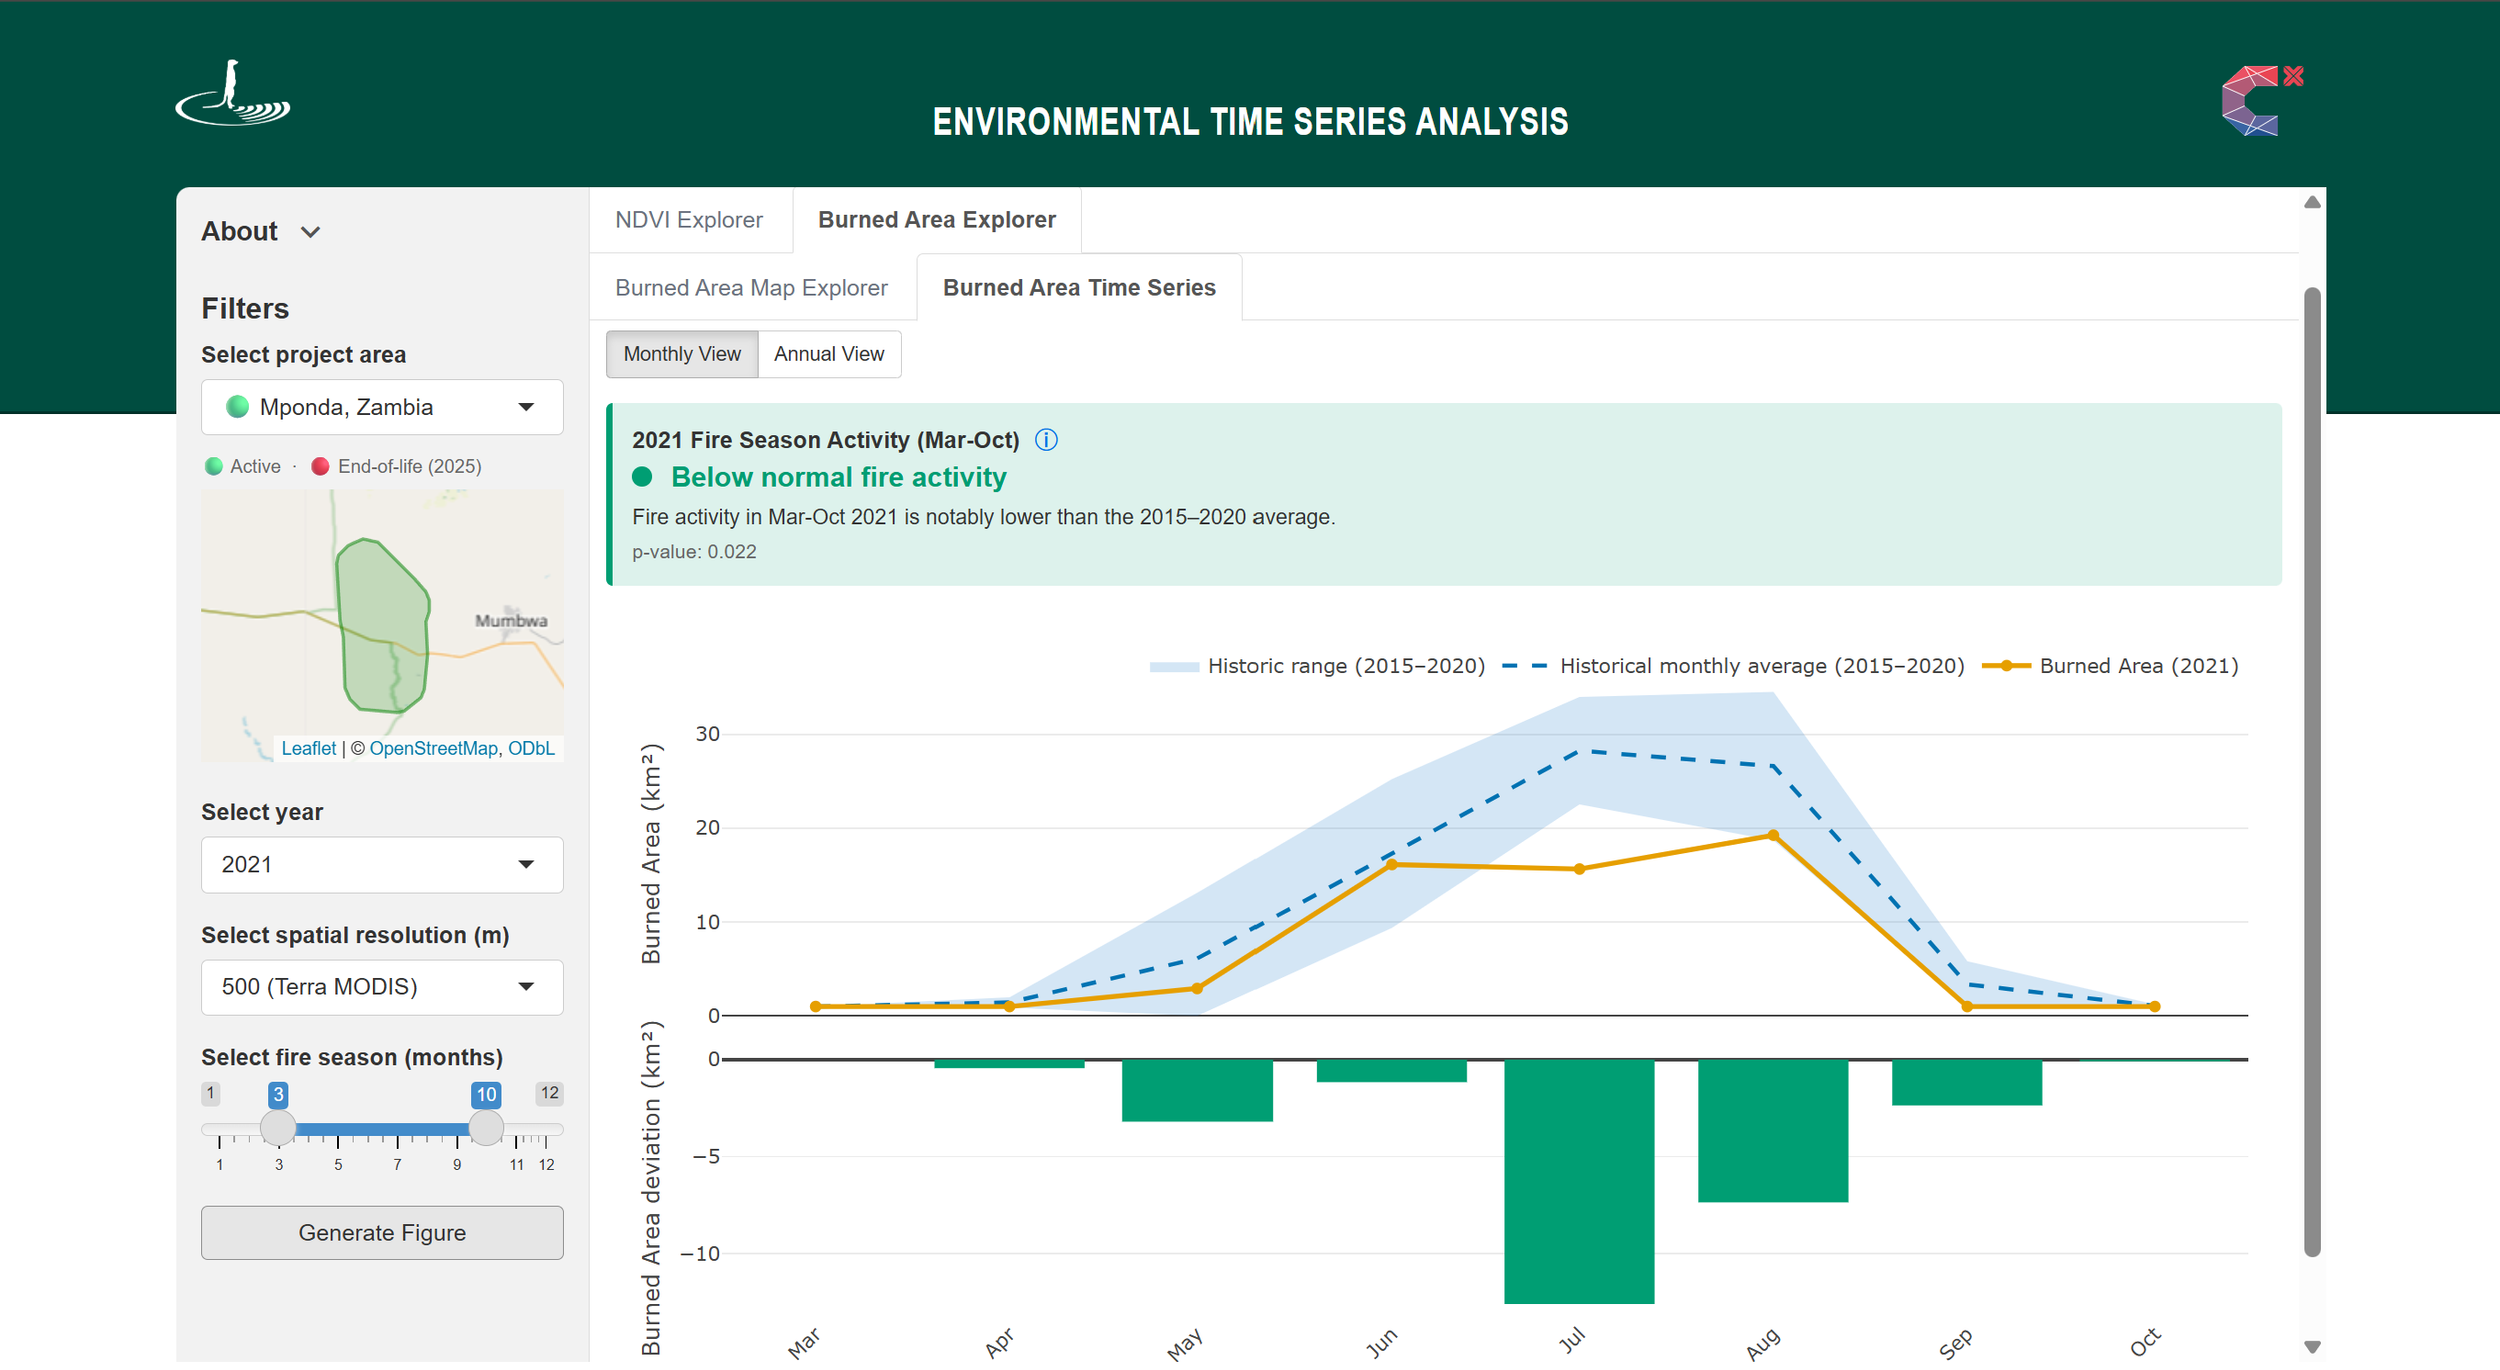
One of the most significant improvements was making the visualisations more interactive. This was also one of the first major milestones and created an immediate "wow" effect during demonstrations. We moved from static images to interactive graphs that allow users to zoom in, select specific datasets, and explore individual data points for additional information. These enhancements make the tools far more engaging and useful for day-to-day analysis.
3. Several improvements focused on helping users better understand environmental data. Which enhancements do you think will have the biggest impact for conservation practitioners using the tools?
Beyond the improvements in usability, we added additional statistics, contextual information, and explanatory elements to help users interpret environmental trends more easily. For example, users can now better understand whether a trend is stable or changing, and identify unusual patterns or anomalies in the data. I am also particularly excited about the potential of adding environmental scenario analysis (e.g. drought). Although still a concept we explored together, I believe it could provide valuable insights for better decision-making in future projects.
4. This year, conservation partners were involved early in the process. How did their feedback influence the team's work, and were there any suggestions that significantly shaped the final outcomes?
Involving conservation partners from the beginning was incredibly valuable. While the team brings strong expertise in data science and software development, conservation practitioners are the people using these tools in real-world situations every day. Their feedback helped us move beyond assumptions and better understand what information is most useful in the field. Ultimately, our goal is not to create just another tool that could be useful, but a platform that genuinely helps conservation practitioners make an impact every day. Feedback from one of our partners in Zambia has been particularly encouraging. They described the tool as "very slick" and highlighted that it enables users to interpret results without requiring technical expertise or support from engineers — a significant improvement over the tools they currently use.
5. Now that the challenge has come to an end, what would you like to see happen next for the Environmental Time Series Analysis tools?
I believe we now have a very strong foundation to build on. There are many opportunities to further expand the platform by adding new scenarios, indicators, and data sources. One area I would particularly like to explore is the inclusion of additional vegetation indices, such as "woodiness" indicators, that complement NDVI by providing insights beyond vegetation greenness. Integrating new datasets would help create an even more complete picture of environmental change and support earlier detection of emerging issues, ultimately helping conservation practitioners make more informed decisions.
Background Information
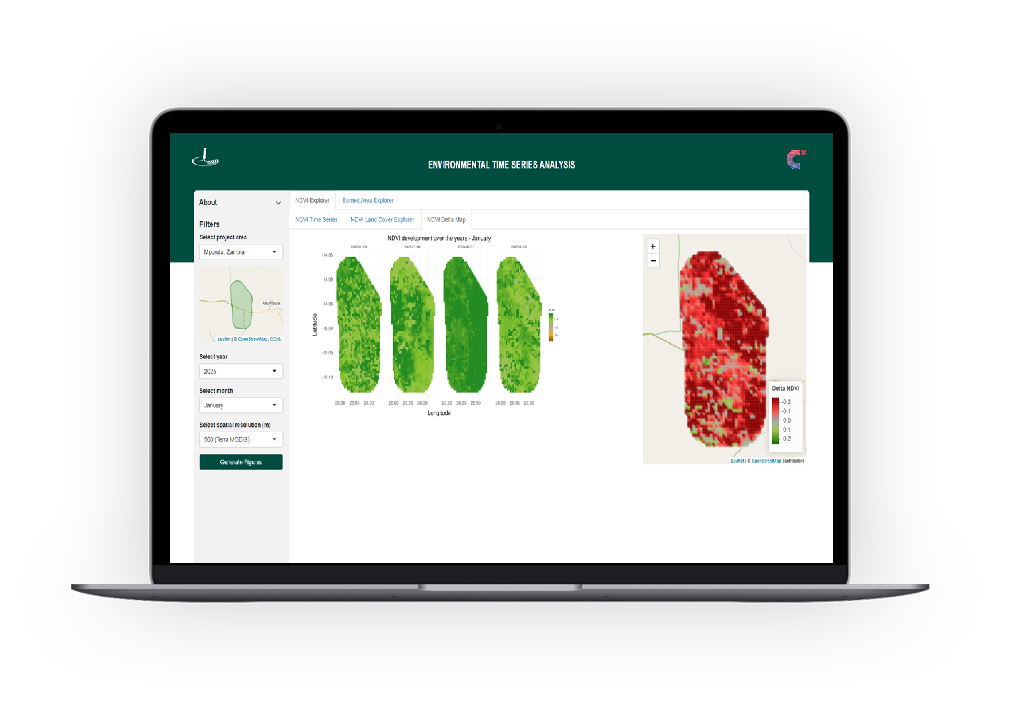
The Environmental Time Series Analysis is a web application that uses satellite-derived data to support environmental monitoring. It can be used to track vegetation health, analyse land cover change, monitor burned areas, and support a range of other conservation and land management tasks. The current version focuses on NDVI (vegetation health) and burned areas through two main Explorers:
NDVI Explorer – Includes the NDVI Time Series, NDVI Land Cover Explorer, and NDVI Delta Map for analysing vegetation trends and spatial patterns over time.
Burned Area Explorer – Includes the Burned Area Time Series and Burned Area Map Explorer for monitoring fire occurrence and burned areas across years.